Treasury
3-MO 3.92% unch 6-MO 4.00% unch 1-YR 4.16% -2bp 2-YR 4.39% unch 3-YR 4.45% -1bp 5-YR 4.54% -1bp 7-YR 4.66% unch 10-YR 4.79% unch 20-YR 5.27% unch 30-YR 5.27% unch 3-MO 3.92% unch 6-MO 4.00% unch 1-YR 4.16% -2bp 2-YR 4.39% unch 3-YR 4.45% -1bp 5-YR 4.54% -1bp 7-YR 4.66% unch 10-YR 4.79% unch 20-YR 5.27% unch 30-YR 5.27% unch 3-MO 3.92% unch 6-MO 4.00% unch 1-YR 4.16% -2bp 2-YR 4.39% unch 3-YR 4.45% -1bp 5-YR 4.54% -1bp 7-YR 4.66% unch 10-YR 4.79% unch 20-YR 5.27% unch 30-YR 5.27% unch 3-MO 3.92% unch 6-MO 4.00% unch 1-YR 4.16% -2bp 2-YR 4.39% unch 3-YR 4.45% -1bp 5-YR 4.54% -1bp 7-YR 4.66% unch 10-YR 4.79% unch 20-YR 5.27% unch 30-YR 5.27% unch 3-MO 3.92% unch 6-MO 4.00% unch 1-YR 4.16% -2bp 2-YR 4.39% unch 3-YR 4.45% -1bp 5-YR 4.54% -1bp 7-YR 4.66% unch 10-YR 4.79% unch 20-YR 5.27% unch 30-YR 5.27% unch 3-MO 3.92% unch 6-MO 4.00% unch 1-YR 4.16% -2bp 2-YR 4.39% unch 3-YR 4.45% -1bp 5-YR 4.54% -1bp 7-YR 4.66% unch 10-YR 4.79% unch 20-YR 5.27% unch 30-YR 5.27% unch
US Treasury par yield curve · Sep 2 · Source: U.S. Treasury
Thursday, September 3, 2026
U.S. Edition
Australia

Australia's goods surplus narrowed to A$1.923bn as exports fell 3.3 percent
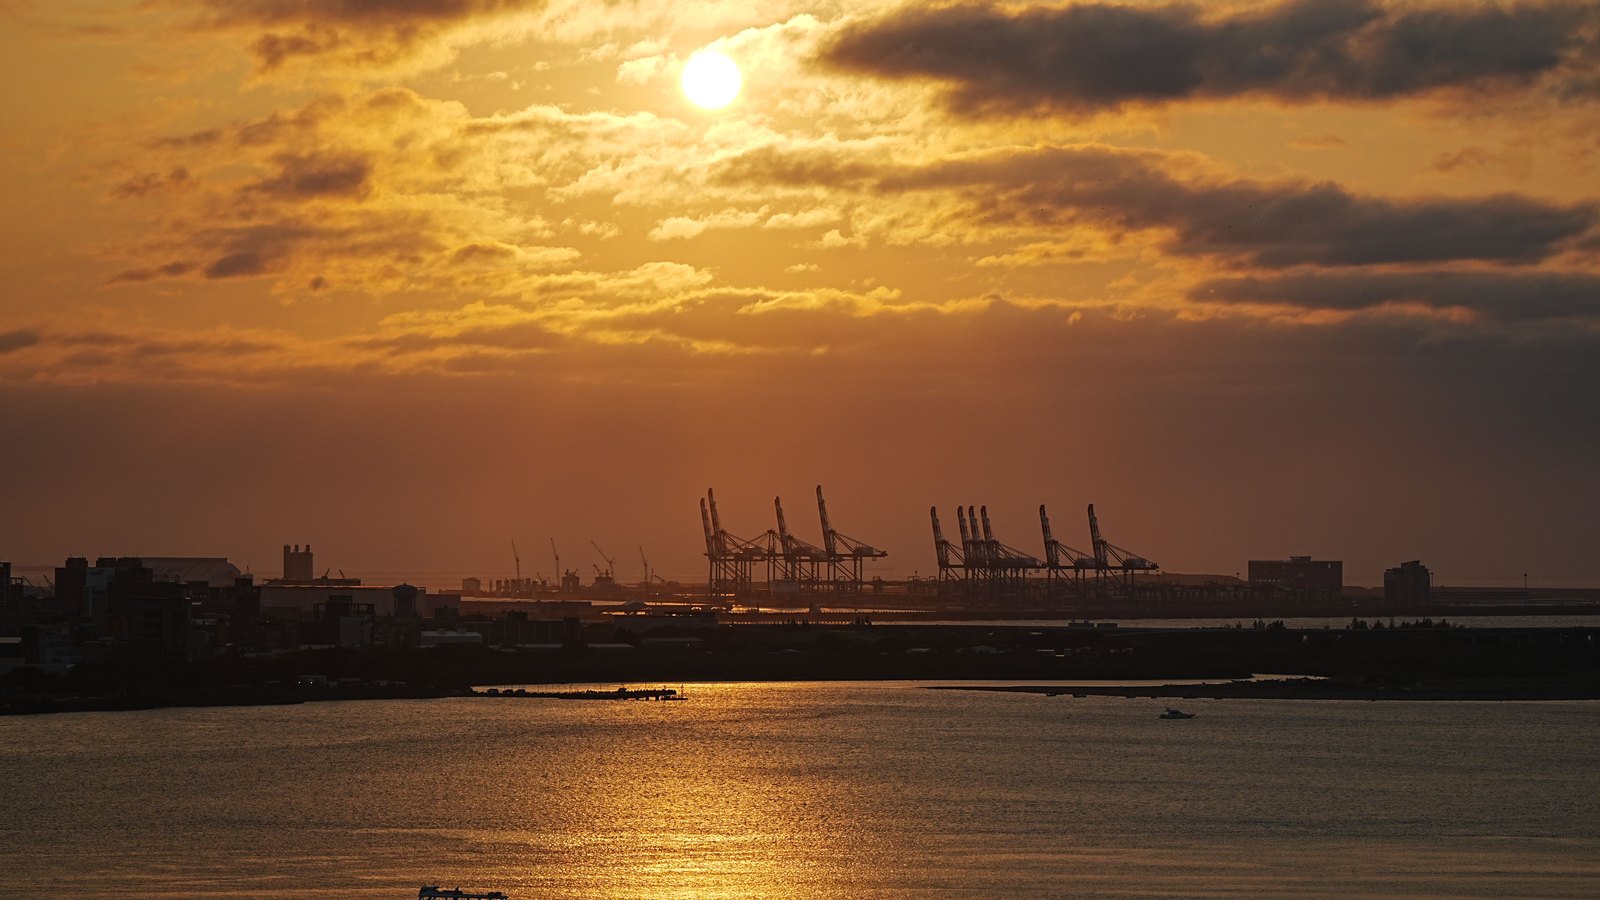
Container cranes stand in silhouette across a harbor at sunset. Stock photo
Stock photo. Not the actual scene. Photo: William Chen / Pexels

Australia's seasonally adjusted goods surplus narrowed to A$1.923bn in July, the Australian Bureau of Statistics reported Thursday. That was A$418m below June's A$2.341bn surplus.

Both sides fell.

Exports declined by A$1.576bn to A$46.261bn, a 3.3 percent drop. The agency identified non-monetary gold and coal, coke and briquettes as the main drivers.

Imports fell by A$1.157bn to A$44.339bn, down 2.5 percent. Fuel and lubricants and non-monetary gold led that decline.

The surplus followed an A$2.392bn goods deficit in May. The release measures goods and does not include services trade.