The data center efficiency number that can improve while the power bill rises
Power usage effectiveness measures the electricity around the computers, not the work done by them. Federal project records show why a lower PUE can describe real savings and still leave most of the energy story unanswered.
Power usage effectiveness has the authority of a physical measurement and the convenience of a single number. That combination makes it easy to ask the number to do more than it can.
A data center with a PUE of 1.2 uses 1.2 units of facility energy for every unit delivered to its information technology equipment. The remaining 0.2 supports cooling, power conversion, lighting and other infrastructure. The ratio says nothing about whether the computers are busy, whether newer servers do more work per watt or whether twice as many machines arrived during the year.
The distinction matters as artificial intelligence pushes both rack density and total electricity demand higher. A lower PUE can mark excellent engineering. It can also accompany a much larger electric bill.
The federal record contains both sides of the point. A National Renewable Energy Laboratory project reduced PUE from 2.28 to 1.16 while cutting overall power by 60 percent. In another federal demonstration, PUE fell from 1.83 to 1.51 while total power fell 17 percent. Both projects improved. The percentage attached to that improvement depends on which part of the electric load is being measured.
What does power usage effectiveness measure?
PUE measures the energy used by an entire data center divided by the energy delivered to its IT equipment. It is an infrastructure ratio. Cooling, power conversion, fans, pumps and lighting sit above the denominator. Server utilization, computational output and the efficiency of the processors themselves do not.
The Department of Energy's 2024 design guide states the limitation plainly: PUE does not define the efficiency of the entire data center. It defines the efficiency of the supporting equipment inside it.
The arithmetic is simple:
| Measure | Formula | Meaning |
|---|---|---|
| PUE | Total facility energy divided by IT energy | All facility energy required for each unit delivered to IT equipment |
| PUE minus one | Non-IT energy divided by IT energy | Cooling, electrical and other infrastructure overhead for each unit of IT energy |
| Total facility energy | IT energy multiplied by PUE | The electricity the whole data center uses within the measurement boundary |
At a PUE of 2.0, every megawatt delivered to IT equipment requires another megawatt for the surrounding facility. At 1.2, every IT megawatt requires 0.2 megawatt of overhead. Moving from 2.0 to 1.2 cuts infrastructure overhead by 80 percent, but it cuts total facility power by 40 percent if the IT load does not change.
Those are different percentages, both derived from the same two measurements. The first describes the improvement in cooling and electrical overhead. The second describes what happened at the meter under a fixed IT workload.
Why can PUE improve while total electricity use rises?
IT energy appears in both the denominator and, as part of facility energy, the numerator. If new computing load grows faster than cooling and power overhead, PUE falls even while the site consumes more electricity. That is useful evidence of infrastructure scale. It is not evidence that the electric meter moved down.
Consider a data center using 10 megawatts for IT equipment at a PUE of 1.4. Its total load is 14 megawatts. If its IT load doubles to 20 megawatts and PUE improves to 1.2, the total becomes 24 megawatts. PUE improved by 14.3 percent. Total power rose by 71.4 percent.
Nothing in that example is contradictory. The facility reduced its overhead from 0.4 to 0.2 unit per unit of IT energy, while the denominator doubled. It became better at supporting each computing watt and used more electricity in total.
The Environmental Protection Agency found this scale effect in the reference data behind the ENERGY STAR score for data centers. After filtering its survey to 61 stand-alone facilities with comparable meter locations, EPA found that higher annual IT energy was associated with lower PUE. Annual IT energy was the only operating characteristic retained in the final regression.
The sample had a mean PUE of 1.924 and a range from 1.362 to 3.598. The PUE regression explained 11.38 percent of the variation in the ratio. EPA therefore does not compare every raw PUE as though a small enterprise server room and a large computing facility faced identical conditions. Its score adjusts the predicted PUE for annual IT energy, up to a cap.
This is the denominator problem in official form. Larger IT loads can support lower overhead per unit. They can also produce much higher total consumption.
What did completed federal data center projects achieve?
Published federal case studies show real reductions in PUE, total power and cooling energy. They also show why the measures cannot be substituted for one another. NREL's Research Support Facility cut both IT and infrastructure loads. A USDA sensor project mainly cut cooling. NREL's later Peregrine facility paired low PUE with heat recovery.
The most complete before-and-after record is NREL's Research Support Facility in Golden, Colorado. The December 2011 FEMP case study reports that PUE fell from 2.28 in the legacy center to 1.16 in the new facility. Annual energy use fell by nearly 1.45 million kilowatt-hours, the average total load fell by 165 kilowatts and overall power fell 60 percent.
Cooling was not the whole result. NREL reported a 23 percent reduction in IT load, a 96 percent reduction in cooling load, and an 82 percent reduction across lighting, miscellaneous loads and system losses. The legacy servers had utilization below 5 percent. Virtualized blade servers and newer equipment reduced the server energy footprint, while outdoor air, evaporative cooling and a more efficient uninterruptible power supply reduced the surrounding load.
The numbers reconcile. A 23 percent reduction in IT load combined with a move from PUE 2.28 to 1.16 implies a total-power reduction of about 60.8 percent. The source reports 60 percent, with its inputs rounded. PUE alone would have implied a 49.1 percent reduction if the IT load had stayed fixed. The rest came from reducing IT energy itself.
The USDA demonstration in St. Louis isolates the infrastructure side more cleanly. FEMP's wireless sensor network case study reports that real-time temperature, humidity, pressure and power data led to a 48 percent reduction in cooling load and a 17 percent reduction in total data center power. PUE moved from 1.83 to 1.51, saving 657 megawatt-hours and nearly $30,000 a year. The sensor system cost $101,000, for a calculated simple payback of 3.4 years.
Here, the ratio and the meter line up almost exactly. Holding IT energy constant, the PUE change implies a 17.5 percent reduction in total facility energy. Yet infrastructure energy intensity, measured as PUE minus one, fell 38.6 percent, from 0.83 to 0.51.
One project can therefore be described as a 39 percent infrastructure improvement or a 17 percent total-power reduction. Neither description is false. Omitting the denominator makes either one easy to misunderstand.
What does the six-site federal assessment record show?
A 2013 DOE report assessed six Defense Department high-performance computing sites and found substantial opportunities, but most were not completed projects when published. Weighting the report's PUE values by IT load produces a potential move from 1.770 to 1.614. That cuts projected infrastructure overhead 20.2 percent and total facility power 8.8 percent.
The FEMP assessment report examined sites with different computing systems and cooling designs in 2011. Its Table 1 lists 9,127 megawatt-hours of potential annual savings across the six sites when the rows are summed, with roughly $1m in potential annual energy-cost savings and an average payback of less than two years in the executive summary.
The published PUE table permits a second calculation:
| Site | IT load | Current PUE | Potential PUE | Total-power reduction at constant IT | Infrastructure-overhead reduction |
|---|---|---|---|---|---|
| Site 1 | 2,000 kW | 1.68 | 1.64 | 2.4% | 5.9% |
| Site 2A | 1,050 kW | 1.92 | 1.57 | 18.2% | 38.0% |
| Site 2B | 810 kW | 1.98 | 1.63 | 17.7% | 35.7% |
| Site 3 | 1,670 kW | 1.63 | 1.56 | 4.3% | 11.1% |
| Site 4 | 550 kW | 1.82 | 1.71 | 6.0% | 13.4% |
| Site 5 | 510 kW | 1.88 | 1.65 | 12.2% | 26.1% |
Across 6,590 kilowatts of listed IT load, the rounded table implies total facility load falling from 11,661.7 to 10,636.0 kilowatts. That is 1,025.7 kilowatts, or 8.8 percent. Measured against non-IT overhead alone, the same change is 20.2 percent.
The two annual energy totals do not match exactly. Multiplying the rounded PUE table by 8,760 hours produces about 8,985 megawatt-hours, while the site-specific project estimates sum to 9,127. The difference is 1.6 percent and is consistent with using rounded PUE and load values rather than the assessment calculations underneath Table 1.
The report's implementation table is the more important caution. Many air-management, cooling, generator-heater and chilled-water measures remained labeled “Potential.” Several were partly done. Lighting retrofits were implemented at two sites. The report documented an opportunity set, not a verified portfolio of realized savings.
That distinction is often lost when an assessment number is repeated later. Potential PUE is a modeled destination. A post-project annual PUE is a measured result.
Why did a DOE program report a 36 percent improvement?
DOE's Data Center Accelerator measured infrastructure energy intensity as PUE minus one, not as total electricity use and not as the percentage decline in PUE itself. Its 21 public and private partners achieved an average 36 percent improvement in that overhead ratio and reported $3.9m in annual cost savings.
The definition appears on the Data Center Accelerator Toolkit. Participating owners worked to reduce infrastructure energy per unit of IT energy by 25 percent over five years. The reported average exceeded that target.
The program result cannot be converted into a total-electricity percentage without each participant's starting PUE and IT load. An illustration shows why. If a facility began at PUE 1.6, its infrastructure intensity was 0.6. A 36 percent improvement would reduce that to 0.384 and produce PUE 1.384. With IT energy fixed, total facility energy would fall 13.5 percent, not 36 percent.
If IT energy grew during the same period, the site's total electricity could fall less, remain flat or rise. The reported $3.9m confirms that the program generated financial savings in aggregate. It does not turn the 36 percent infrastructure ratio into a 36 percent reduction at every participant's utility meter.
The Accelerator also was not a federal-facility-only experiment. Its partner list included federal agencies and national laboratories alongside universities and private companies. The result is an official DOE program figure, not a representative sample of all federal data centers.
What important costs does PUE leave outside the frame?
PUE leaves out the efficiency and utilization of IT equipment, useful computing output, the carbon content of electricity, water consumption and the benefit of recovered heat. It also does not price reliability or redundancy. DOE recommends reading PUE beside productivity, water, carbon and energy-reuse measures rather than promoting one ratio into a verdict.
The first omission is the largest. A server drawing substantial power while doing little work still sits entirely inside the IT denominator. Replacing it with a newer server that performs the same work with half the energy may reduce total electricity, but the lower denominator can make PUE rise if facility overhead does not fall as quickly. The data center became more energy efficient while its infrastructure ratio became worse.
The reverse is also possible. Adding heavily used servers can improve PUE because fixed cooling and electrical losses are spread over a larger IT denominator. The facility looks better by PUE and consumes more power. Neither effect is an error in the ratio. Both are reasons to measure useful work.
Water requires another metric. The Money & World analysis of data center water use separates on-site consumption from water used to generate electricity. DOE's guide defines site water usage effectiveness as annual site water divided by IT energy. A source-based version adds off-site water used in energy production. PUE contains neither number.
Carbon depends on the electricity supply. Two facilities with identical PUE can have different emissions if their grids or contracted generation differ. Carbon usage effectiveness relates emissions to IT energy, but it still needs a disclosed accounting boundary.
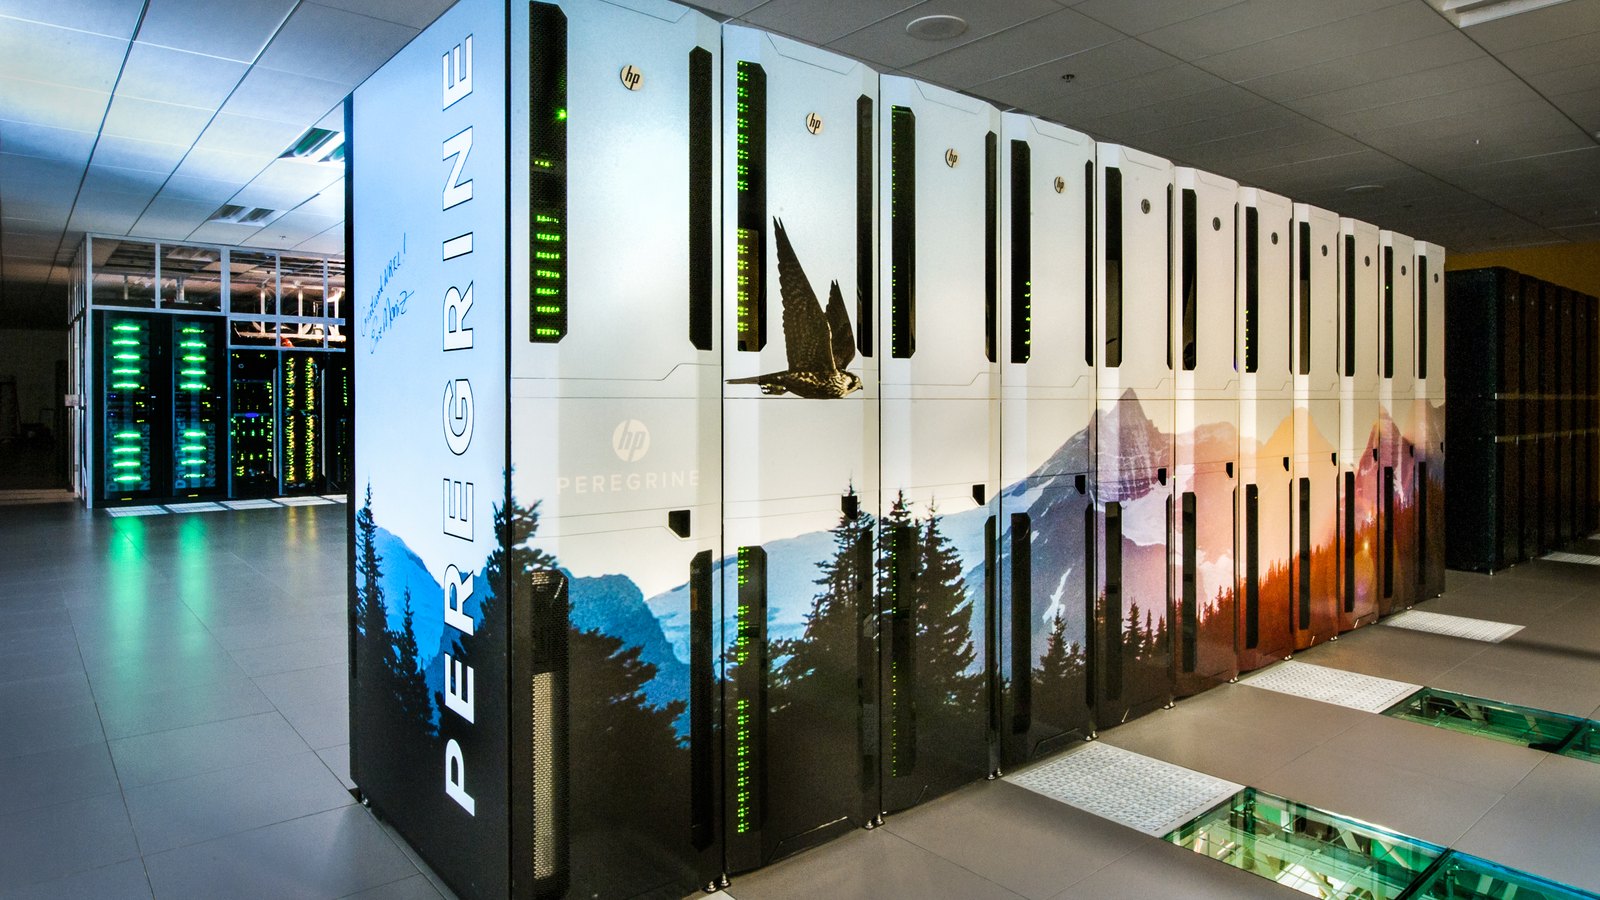
Heat recovery is especially revealing. DOE's 2014 Sustainability Awards report says NREL's Peregrine high-performance computing data center operated at annual PUE of 1.06. Compared with a 1.9 reference facility, DOE calculated 840 kilowatts saved per megawatt of IT equipment, equal to 7,358 megawatt-hours and about $800,000 a year. Warm-water cooling also recovered heat for offices and laboratories, saving another estimated $200,000.
PUE captures the low facility overhead. It does not credit the useful heat exported from the data center. Energy reuse effectiveness exists for that purpose. The $200,000 sits outside PUE even though it is part of the project's economic result.
How should two PUE values be compared?
Compare annual values measured at the same IT meter location and with the same facility boundary. Then place total energy and IT energy beside the ratios. Raw PUE comparisons across different scales, climates, redundancy practices or reporting periods can mislead even when every number is correctly measured.
EPA requires IT energy at the output of the uninterruptible power supply for most data centers seeking an ENERGY STAR score. It rejected records measured at inconsistent locations when it built its reference sample. A reading at the power distribution unit or server input excludes losses that a reading at the UPS output includes.
Source and site energy also should not be mixed. DOE's standard PUE discussion uses site energy, the electricity and other energy crossing the facility boundary. ENERGY STAR computes a source-energy version that accounts for conversion losses before energy reaches the site. Both approaches can be useful. Their ratios are not interchangeable without the conversion method.
Time matters as well. An annual PUE captures seasonal cooling and changing IT load. A favorable reading taken during cool weather or at high server load is not the same thing. DOE's design guide specifically uses annual energy, not one moment of power demand, in its definition.
Finally, a claimed improvement needs a stable workload or an explicit workload measure. Total facility megawatt-hours, IT megawatt-hours and PUE allow the reader to separate infrastructure from IT changes. Transactions, jobs completed or another workload-specific unit can then show whether the computers did more with the energy they received.
What should a reader ask for besides PUE?
Ask for total facility energy, IT energy, the PUE boundary, server utilization and a measure of useful work. Add water use, carbon intensity and recovered heat where they matter. A credible efficiency claim supplies the numerator, denominator and time period, then states whether savings were measured after completion or modeled before it.
The three-number check is a practical minimum:
- Total facility megawatt-hours show the billable energy inside the stated boundary.
- IT megawatt-hours show how much reached the computing equipment.
- PUE shows the relationship between them and can be reproduced by division.
The national electricity-demand analysis answers a different question about the industry's total load. The construction-cost analysis separates IT capacity from utility capacity for the same reason. A megawatt can describe the computers or the whole campus. PUE is the bridge between those numbers, not a replacement for either one.
Project status belongs beside the measurements. The Defense Department assessment labeled many measures as potential. The NREL and USDA case studies reported operating results. A forecast with a short payback can support an investment decision, but only a post-project meter can establish realized savings.
What else do readers ask about data center energy efficiency?
Most short questions about PUE turn on the same boundary. A low ratio is desirable for infrastructure, but it is not a universal grade. The theoretical floor, the effect of liquid cooling and the connection to cost all depend on what energy enters the numerator and what work sits behind the IT denominator.
Is a PUE of 1.2 good?
It is low infrastructure overhead under the DOE guide's scale, which lists 1.1 as “better” and 1.6 as “standard.” The comparison still needs the measurement boundary, annual period and IT load. It does not establish efficient servers or low total electricity use.
Can PUE be lower than 1.0?
Not under the standard formula. Total facility energy includes IT energy, so the numerator cannot be smaller than the denominator within the same boundary. DOE gives PUE a mathematical range from 1.0 upward. Energy reuse effectiveness can fall below 1.0 because it subtracts recovered energy from the numerator.
Does liquid cooling always improve PUE?
No. Liquid cooling can reduce fan and chiller energy, especially at high rack densities, but the result depends on pumps, heat rejection, climate, operating temperatures and the previous system. The measured annual ratio, not the cooling label, establishes the infrastructure result.
Does lower PUE guarantee a lower electricity bill?
No. At a fixed IT load and electricity price, a lower PUE lowers facility electricity. If IT energy or price rises, the bill can still increase. The total megawatt-hours and tariff are required to calculate cost.
Why use PUE if it has these limits?
Because cooling and electrical overhead are large, measurable and manageable. PUE gives operators a common way to track that part of the facility. The mistake is not using the ratio. It is treating an infrastructure ratio as though it measured the computers, the grid, the water system and the electric bill at once.