Treasury
3-MO 3.89% -3bp 6-MO 3.95% -5bp 1-YR 4.11% -5bp 2-YR 4.34% -5bp 3-YR 4.41% -4bp 5-YR 4.52% -2bp 7-YR 4.63% -3bp 10-YR 4.77% -2bp 20-YR 5.25% -2bp 30-YR 5.25% -2bp 3-MO 3.89% -3bp 6-MO 3.95% -5bp 1-YR 4.11% -5bp 2-YR 4.34% -5bp 3-YR 4.41% -4bp 5-YR 4.52% -2bp 7-YR 4.63% -3bp 10-YR 4.77% -2bp 20-YR 5.25% -2bp 30-YR 5.25% -2bp 3-MO 3.89% -3bp 6-MO 3.95% -5bp 1-YR 4.11% -5bp 2-YR 4.34% -5bp 3-YR 4.41% -4bp 5-YR 4.52% -2bp 7-YR 4.63% -3bp 10-YR 4.77% -2bp 20-YR 5.25% -2bp 30-YR 5.25% -2bp 3-MO 3.89% -3bp 6-MO 3.95% -5bp 1-YR 4.11% -5bp 2-YR 4.34% -5bp 3-YR 4.41% -4bp 5-YR 4.52% -2bp 7-YR 4.63% -3bp 10-YR 4.77% -2bp 20-YR 5.25% -2bp 30-YR 5.25% -2bp 3-MO 3.89% -3bp 6-MO 3.95% -5bp 1-YR 4.11% -5bp 2-YR 4.34% -5bp 3-YR 4.41% -4bp 5-YR 4.52% -2bp 7-YR 4.63% -3bp 10-YR 4.77% -2bp 20-YR 5.25% -2bp 30-YR 5.25% -2bp 3-MO 3.89% -3bp 6-MO 3.95% -5bp 1-YR 4.11% -5bp 2-YR 4.34% -5bp 3-YR 4.41% -4bp 5-YR 4.52% -2bp 7-YR 4.63% -3bp 10-YR 4.77% -2bp 20-YR 5.25% -2bp 30-YR 5.25% -2bp
US Treasury par yield curve · Sep 3 · Source: U.S. Treasury
Friday, September 4, 2026
U.S. Edition
Employment Situation

US payrolls rose 162,000 in August and July's loss became a 21,000 gain
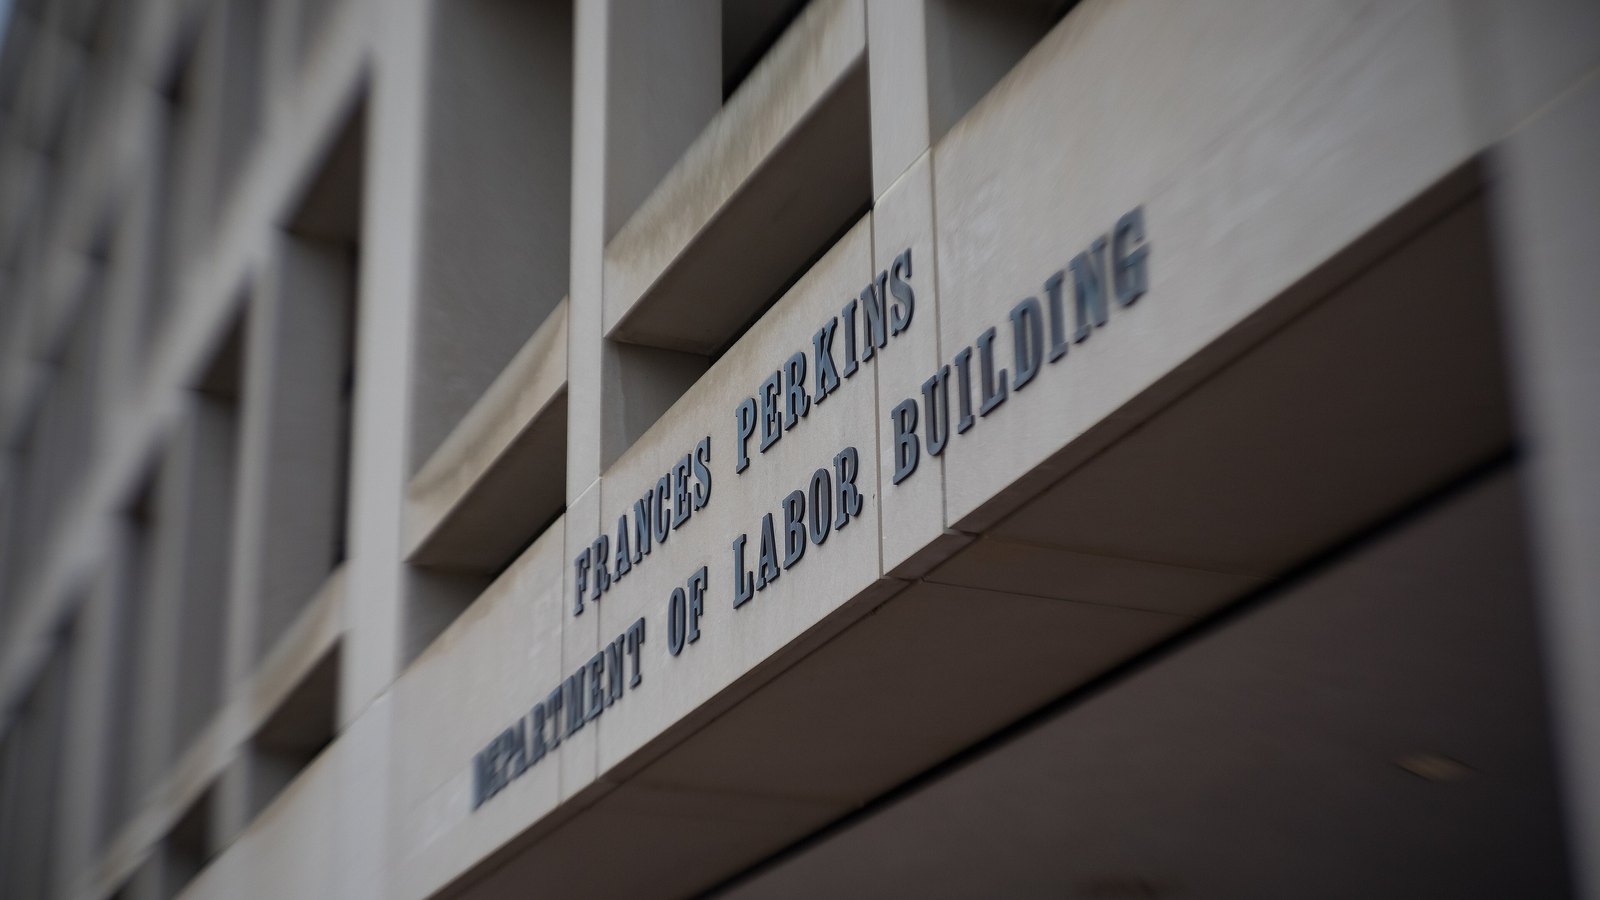
The names of the Frances Perkins Building and the United States Department of Labor appear above the building entrance in Washington.
Photo: US Department of Labor / Wikimedia Commons (CC BY 2.0)

July is no longer a loss.

The Bureau of Labor Statistics revised that month from 23,000 fewer payroll jobs to 21,000 more, while June rose from 20,000 to 31,000. August then added 162,000 jobs. That is above the average monthly gain of 31,000 during the previous year.

The unemployment rate held at 4.1 percent. Food services and drinking places added 59,000 jobs, local government education added 42,000, and information lost 23,000. Average hourly earnings rose 0.3 percent in August and 3.1 percent from a year earlier.

One month is preliminary. The next two releases can revise it as more employer reports arrive.