Treasury
3-MO 4.17% -3bp 6-MO 4.27% -6bp 1-YR 4.44% -10bp 2-YR 4.78% -10bp 3-YR 4.91% -9bp 5-YR 5.01% -8bp 7-YR 5.12% -7bp 10-YR 5.24% -5bp 20-YR 5.64% -4bp 30-YR 5.61% -3bp 3-MO 4.17% -3bp 6-MO 4.27% -6bp 1-YR 4.44% -10bp 2-YR 4.78% -10bp 3-YR 4.91% -9bp 5-YR 5.01% -8bp 7-YR 5.12% -7bp 10-YR 5.24% -5bp 20-YR 5.64% -4bp 30-YR 5.61% -3bp 3-MO 4.17% -3bp 6-MO 4.27% -6bp 1-YR 4.44% -10bp 2-YR 4.78% -10bp 3-YR 4.91% -9bp 5-YR 5.01% -8bp 7-YR 5.12% -7bp 10-YR 5.24% -5bp 20-YR 5.64% -4bp 30-YR 5.61% -3bp 3-MO 4.17% -3bp 6-MO 4.27% -6bp 1-YR 4.44% -10bp 2-YR 4.78% -10bp 3-YR 4.91% -9bp 5-YR 5.01% -8bp 7-YR 5.12% -7bp 10-YR 5.24% -5bp 20-YR 5.64% -4bp 30-YR 5.61% -3bp 3-MO 4.17% -3bp 6-MO 4.27% -6bp 1-YR 4.44% -10bp 2-YR 4.78% -10bp 3-YR 4.91% -9bp 5-YR 5.01% -8bp 7-YR 5.12% -7bp 10-YR 5.24% -5bp 20-YR 5.64% -4bp 30-YR 5.61% -3bp 3-MO 4.17% -3bp 6-MO 4.27% -6bp 1-YR 4.44% -10bp 2-YR 4.78% -10bp 3-YR 4.91% -9bp 5-YR 5.01% -8bp 7-YR 5.12% -7bp 10-YR 5.24% -5bp 20-YR 5.64% -4bp 30-YR 5.61% -3bp
US Treasury par yield curve · Oct 1 · Source: U.S. Treasury
Friday, October 2, 2026
U.S. Edition
August factory orders

US factory orders edged up 0.1 percent in August as backlogs kept growing
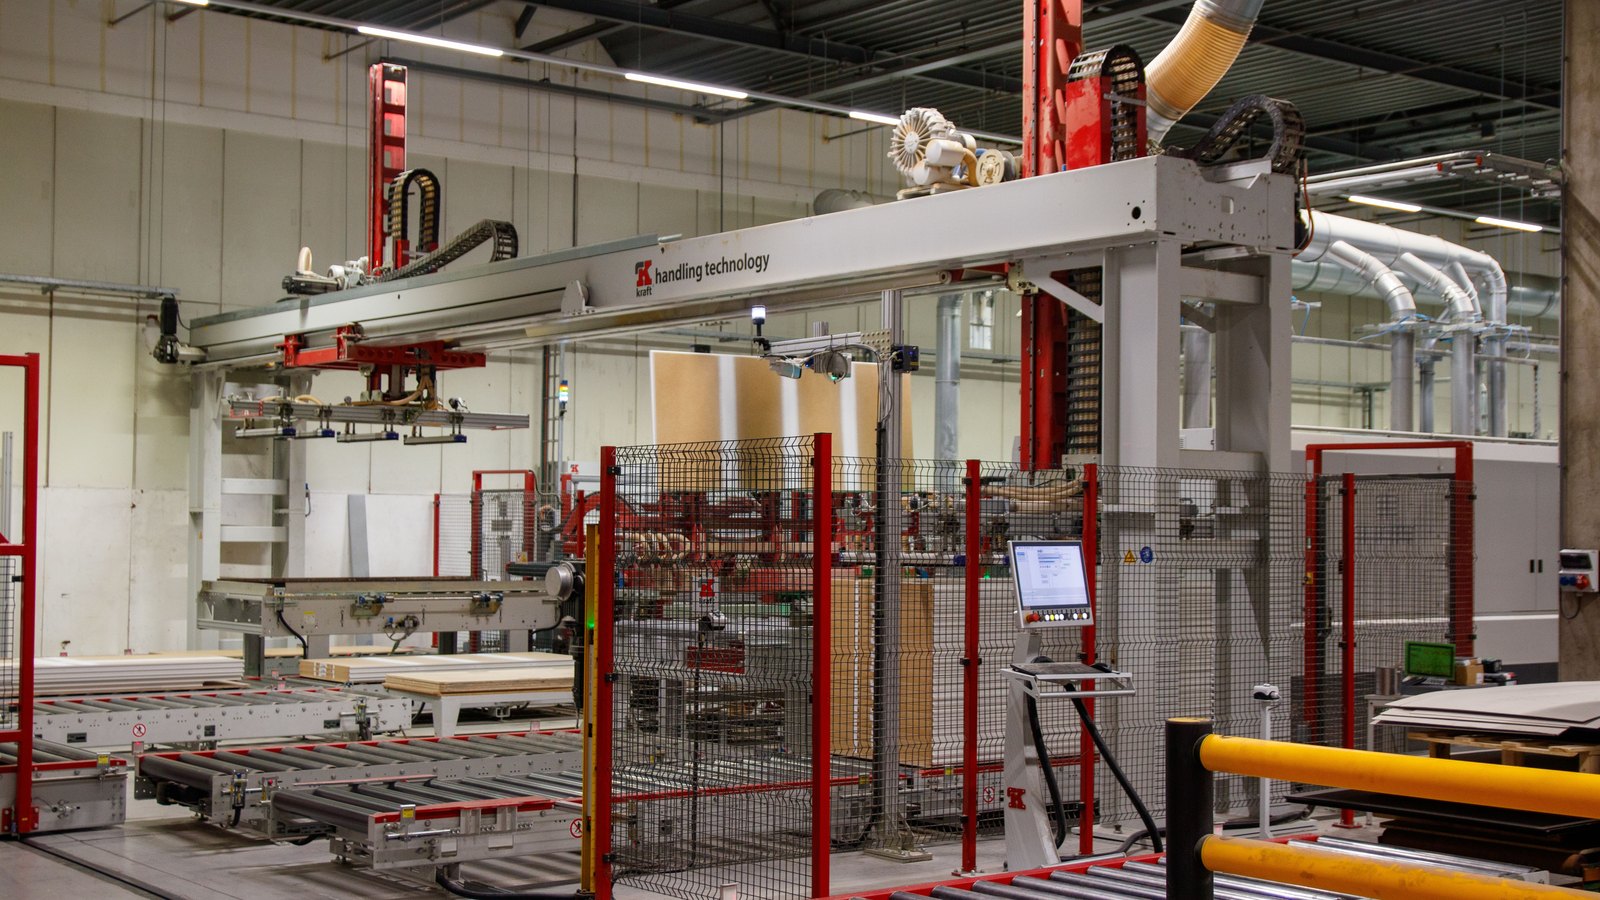
Automated production equipment on a factory floor. Stock photo
Stock photo. Not the actual scene. Photo: Freek Wolsink / Pexels

New orders for manufactured goods rose by $0.7bn in August to a seasonally adjusted $663.5bn, the Census Bureau reported Friday. The 0.1 percent increase followed a 0.8 percent rise in July.

Shipments were virtually unchanged at $658.6bn after eight consecutive monthly increases.

The backlog continued to grow. Unfilled orders rose by $9.9bn, or 0.6 percent, to $1.610tn. The ratio of unfilled orders to shipments increased to 6.87 from 6.81.

Inventories rose for an 11th month, increasing 0.5 percent to $972.4bn. The inventories-to-shipments ratio moved up to 1.48 from 1.47.