Treasury
3-MO 3.91% +2bp 6-MO 3.98% +3bp 1-YR 4.13% +2bp 2-YR 4.37% +3bp 3-YR 4.45% +4bp 5-YR 4.54% +2bp 7-YR 4.65% +2bp 10-YR 4.78% +1bp 20-YR 5.25% unch 30-YR 5.24% -1bp 3-MO 3.91% +2bp 6-MO 3.98% +3bp 1-YR 4.13% +2bp 2-YR 4.37% +3bp 3-YR 4.45% +4bp 5-YR 4.54% +2bp 7-YR 4.65% +2bp 10-YR 4.78% +1bp 20-YR 5.25% unch 30-YR 5.24% -1bp 3-MO 3.91% +2bp 6-MO 3.98% +3bp 1-YR 4.13% +2bp 2-YR 4.37% +3bp 3-YR 4.45% +4bp 5-YR 4.54% +2bp 7-YR 4.65% +2bp 10-YR 4.78% +1bp 20-YR 5.25% unch 30-YR 5.24% -1bp 3-MO 3.91% +2bp 6-MO 3.98% +3bp 1-YR 4.13% +2bp 2-YR 4.37% +3bp 3-YR 4.45% +4bp 5-YR 4.54% +2bp 7-YR 4.65% +2bp 10-YR 4.78% +1bp 20-YR 5.25% unch 30-YR 5.24% -1bp 3-MO 3.91% +2bp 6-MO 3.98% +3bp 1-YR 4.13% +2bp 2-YR 4.37% +3bp 3-YR 4.45% +4bp 5-YR 4.54% +2bp 7-YR 4.65% +2bp 10-YR 4.78% +1bp 20-YR 5.25% unch 30-YR 5.24% -1bp 3-MO 3.91% +2bp 6-MO 3.98% +3bp 1-YR 4.13% +2bp 2-YR 4.37% +3bp 3-YR 4.45% +4bp 5-YR 4.54% +2bp 7-YR 4.65% +2bp 10-YR 4.78% +1bp 20-YR 5.25% unch 30-YR 5.24% -1bp
US Treasury par yield curve · Sep 4 · Source: U.S. Treasury
Tuesday, September 8, 2026
U.S. Edition
GDP revision

Japan lifts second-quarter growth to 1.4 percent annualized as domestic demand subtracts from output
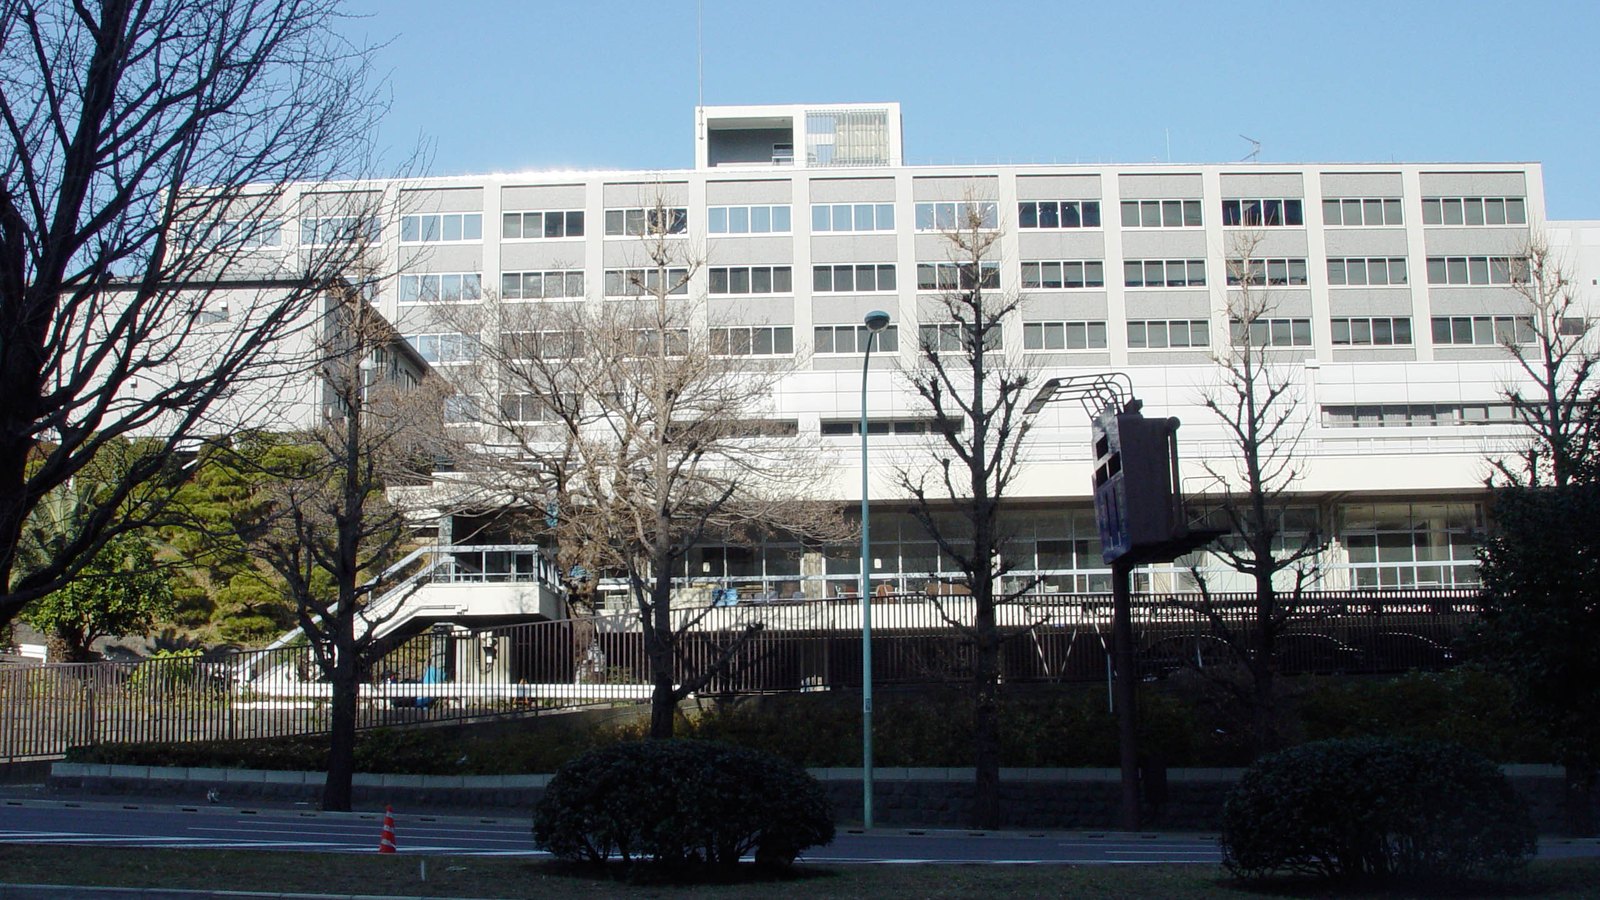
Cabinet Office building in Tokyo viewed from across the street
Photo: っ / Wikimedia Commons (CC BY-SA 3.0)

0.3 percentage points. That is how much Japan added to its annualized second-quarter growth estimate.

Real gross domestic product rose 0.4 percent from the first quarter, or 1.4 percent annualized, the Cabinet Office reported Tuesday in Tokyo. The first estimate was 0.3 percent, or 1.1 percent annualized.

Domestic demand subtracted 0.1 percentage point. Net exports added 0.5 point as exports rose 0.4 percent and imports fell 1.7 percent.

Private consumption was flat. Business investment fell 0.9 percent, while government consumption rose 1.7 percent.