Treasury
3-MO 4.11% unch 6-MO 4.17% -1bp 1-YR 4.39% +2bp 2-YR 4.67% +2bp 3-YR 4.76% +3bp 5-YR 4.83% +3bp 7-YR 4.91% +3bp 10-YR 5.00% +3bp 20-YR 5.40% +3bp 30-YR 5.36% +2bp 3-MO 4.11% unch 6-MO 4.17% -1bp 1-YR 4.39% +2bp 2-YR 4.67% +2bp 3-YR 4.76% +3bp 5-YR 4.83% +3bp 7-YR 4.91% +3bp 10-YR 5.00% +3bp 20-YR 5.40% +3bp 30-YR 5.36% +2bp 3-MO 4.11% unch 6-MO 4.17% -1bp 1-YR 4.39% +2bp 2-YR 4.67% +2bp 3-YR 4.76% +3bp 5-YR 4.83% +3bp 7-YR 4.91% +3bp 10-YR 5.00% +3bp 20-YR 5.40% +3bp 30-YR 5.36% +2bp 3-MO 4.11% unch 6-MO 4.17% -1bp 1-YR 4.39% +2bp 2-YR 4.67% +2bp 3-YR 4.76% +3bp 5-YR 4.83% +3bp 7-YR 4.91% +3bp 10-YR 5.00% +3bp 20-YR 5.40% +3bp 30-YR 5.36% +2bp 3-MO 4.11% unch 6-MO 4.17% -1bp 1-YR 4.39% +2bp 2-YR 4.67% +2bp 3-YR 4.76% +3bp 5-YR 4.83% +3bp 7-YR 4.91% +3bp 10-YR 5.00% +3bp 20-YR 5.40% +3bp 30-YR 5.36% +2bp 3-MO 4.11% unch 6-MO 4.17% -1bp 1-YR 4.39% +2bp 2-YR 4.67% +2bp 3-YR 4.76% +3bp 5-YR 4.83% +3bp 7-YR 4.91% +3bp 10-YR 5.00% +3bp 20-YR 5.40% +3bp 30-YR 5.36% +2bp
US Treasury par yield curve · Sep 15 · Source: U.S. Treasury
Wednesday, September 16, 2026
U.S. Edition
United States

US crude stocks fall 640,000 barrels as fuel supplies rise
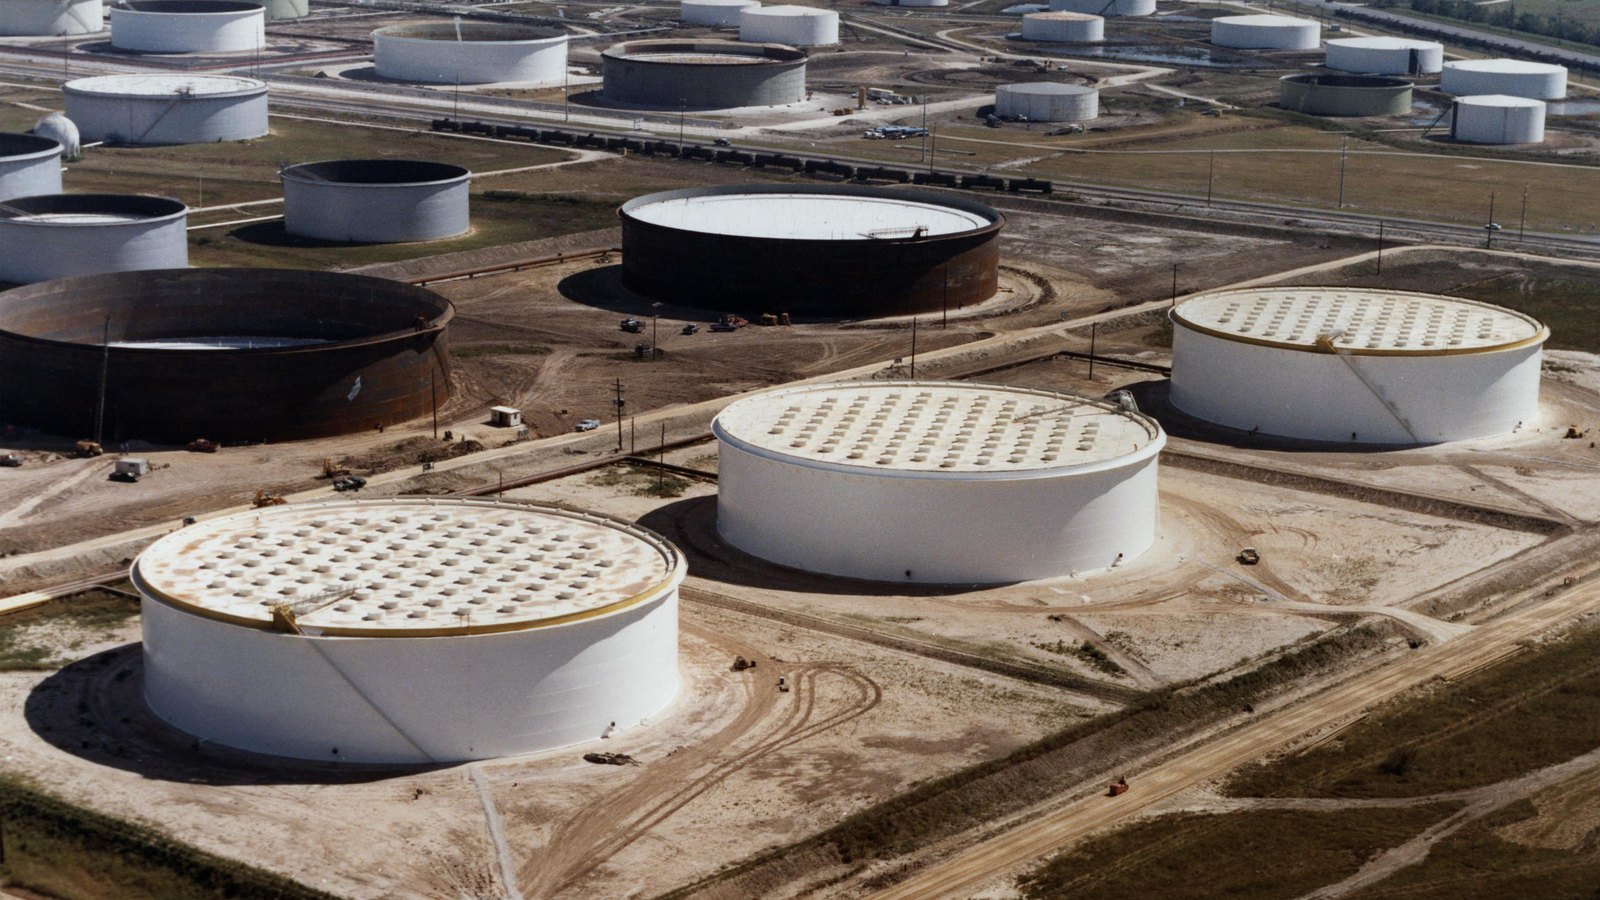
Large petroleum storage tanks stand across an industrial site.
Photo: ENERGY.GOV / Wikimedia Commons (Public domain)

US commercial crude inventories, excluding the Strategic Petroleum Reserve, fell 640,000 barrels to 423.4m in the week ending September 11, EIA data show. Reserve inventories declined 403,000 barrels to 285m.

Fuel supplies moved higher. Gasoline stocks increased 794,000 barrels to 207.7m. Distillate stocks rose 1.59m barrels to 107.9m, leaving them 13.5 percent below a year earlier.

Refinery inputs fell 256,000 barrels a day to 17.33m. Domestic crude output was nearly unchanged at 13.944m barrels a day. The four week average for total products supplied was 0.6 percent lower than a year earlier.