Marco Island's median home is $896,300. Most owners owe no mortgage.
The metro price index says 3.2 percent above the national level. City data show a smaller year-round market, 9,100 seasonal homes and sharply different costs for renters, mortgaged owners and owners without debt.
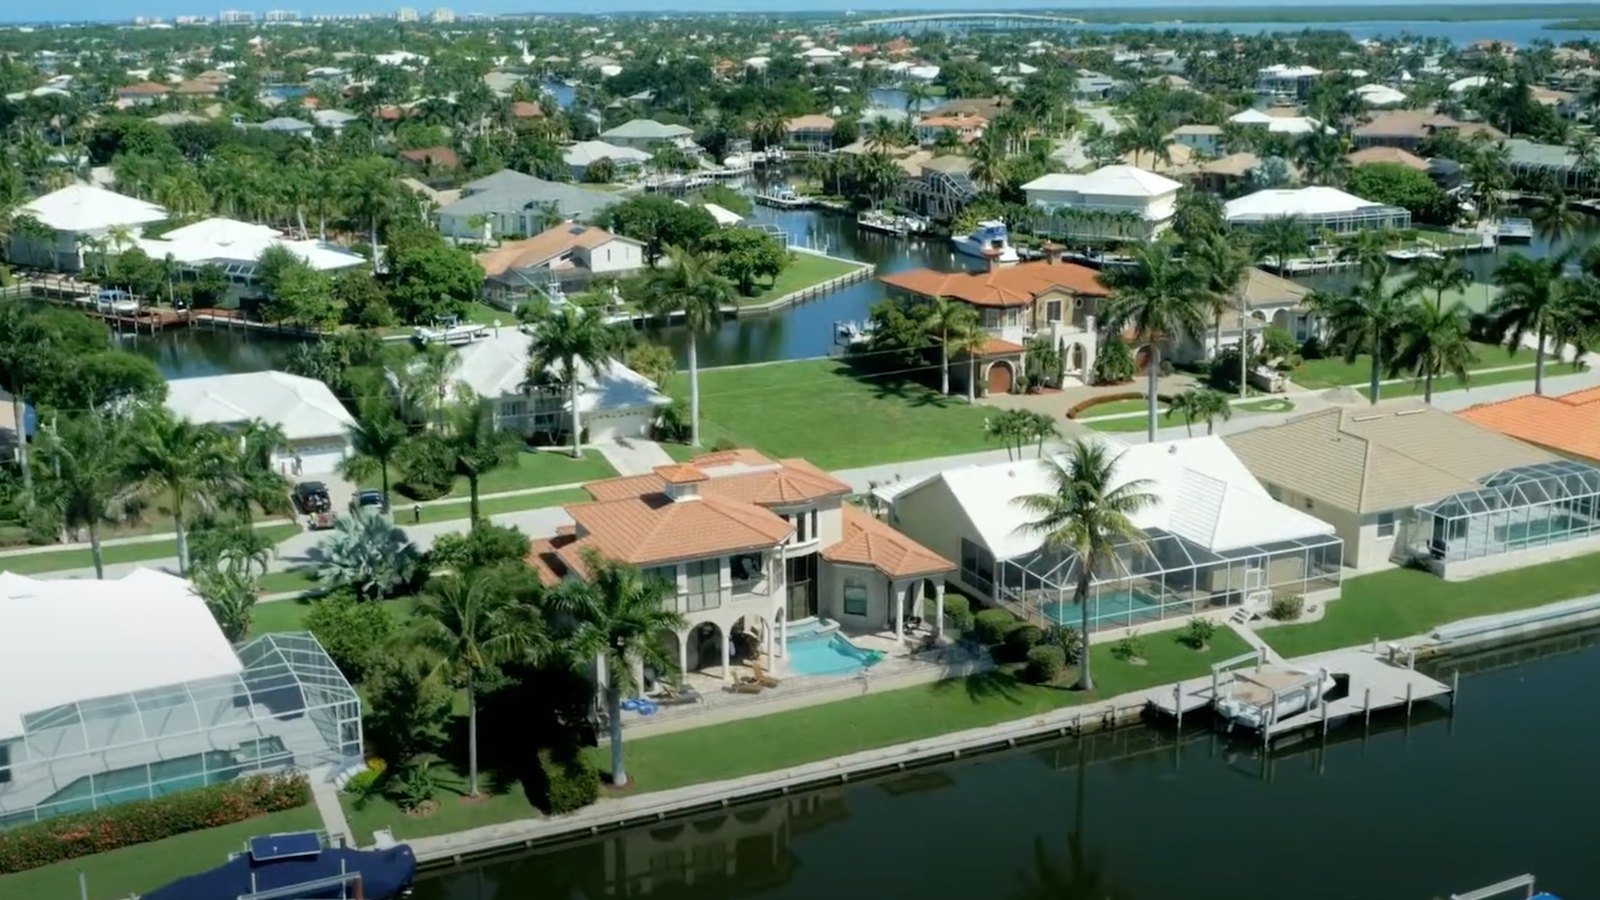
Nine thousand one hundred homes.
That is how many Marco Island housing units the Census Bureau classified as being held for seasonal, recreational or occasional use. The city had 18,500 housing units in all. Nearly half of the stock was therefore outside the year-round occupied market by design.
That fact changes the cost-of-living question. Marco Island is a city of 16,205 residents with 8,609 occupied homes, 9,891 vacant units and only 911 renter households. A price estimate built for an ordinary year-round city does not describe this one well.
The federal data still provide a useful frame. They show how the wider Collier County price level compares with the country, how Marco Island households arrange their housing and what current residents report paying. Current city records then add the municipal property-tax rate and the water and sewer schedule.
They do not produce a quote for one household. They produce a map of the bill.
What is the cost of living in Marco Island, Florida?
Marco Island has no official city cost-of-living index. The wider Naples-Marco Island metro was 3.2 percent above the national price level in 2024. City estimates put median gross rent at $1,990, median home value at $896,300 and median household income at $101,523.
The broad comparison comes from the Bureau of Economic Analysis regional price parity. Its index sets the United States at 100. The Naples-Marco Island metropolitan area measured 103.200 for all items, but that geography is all of Collier County rather than Marco Island alone.
City figures come from the Census Bureau's 2024 American Community Survey five-year estimates. Marco Island is too small for the one-year release, so these estimates pool 60 months of survey responses. They are the best comparable federal city data available, but they are not October 2026 listing prices.
| Marco Island measure | 2024 five-year estimate | Margin of error |
|---|---|---|
| Population | 16,205 | 20 |
| Median age | 67.9 | 1.8 |
| Median household income | $101,523 | $10,735 |
| Per capita income | $95,595 | $9,673 |
| Median gross rent | $1,990 | $197 |
| Median home value | $896,300 | $80,638 |
| Average household size | 1.88 | 0.06 |
The margins matter. The home-value estimate carries a range of roughly $80,600 on either side, and the rent estimate carries about $200. A current asking price can differ sharply from the midpoint. The value of the table is that every figure was built under one federal method for one defined city.
Why does the metro average miss the city housing market?
The metro index mixes Marco Island with Naples, Immokalee, Golden Gate and the rest of Collier County. Its goods and service components sit below the national level, while housing is 29.4 percent above it. Marco Island's tenure and seasonal stock make that county average especially incomplete.
The component split is stark. The BEA data file reports goods at 96.240, utilities at 87.761 and other services at 98.864. Housing stands at 129.441. Shelter carries the entire metro premium and more.
That housing component also requires careful reading. BEA constructs the regional housing price level from rents. It is not a sale-price index, a property-tax rate or an insurance quote. A city where most occupied homes are owner occupied and most owners have no mortgage will experience that rent-based number in several different ways.
Marco Island makes the distinction unusually large. The Census Bureau counted 7,698 owner households and 911 renter households. Owners therefore occupied 89.4 percent of the year-round housing stock. A rent index is useful evidence about the local market, but it directly measures the smaller group.
The metro number is still valid for what it says. Goods across Collier County priced 3.8 percent below the national level in the published model. Utilities priced 12.2 percent below it. Those results do not cancel the city housing bill, and they do not say every Marco Island customer pays less for groceries, electricity or water.
How does seasonal housing change Marco Island's costs?
Seasonal use accounts for 9,100 Marco Island homes, equal to 92.0 percent of vacant units and 49.2 percent of all housing. Only 365 vacant homes were identified as available for rent and 289 as being for sale. The vacancy rate therefore does not represent ordinary available supply.
The Census vacancy table is the most revealing document in the analysis. Marco Island had 18,500 total housing units. Of those, 8,609 were occupied and 9,891 were vacant, a reported vacancy rate of 53.5 percent.
Read alone, that rate would suggest an abundance of empty homes. The reason codes reverse the conclusion. Seasonal, recreational or occasional use accounted for 9,100 units. The for-rent category held 365, while the for-sale-only category held 289. Another 137 fell into the residual other-vacant category.
The city thus had more than ten seasonal units for every renter-occupied home. A seasonal property can remain off the annual rental market while still carrying taxes, insurance, association charges, water and sewer base fees, and maintenance. It adds to the housing count without adding a year-round household.
This also explains why a single vacancy statistic can coexist with high rent. Only 3.7 percent of vacant units were listed for rent. The broad vacant count is real, but most of it is not a waiting room for annual tenants.
How much do Marco Island renters pay?
Median gross rent was $1,990 a month, including tenant-paid utilities and fuels counted by the Census Bureau. Among renters with a computed income ratio, 66.7 percent spent at least 30 percent of household income on housing. Nearly half spent 50 percent or more.
The median gross rent table does not report contract rent alone. Gross rent adds the average monthly cost of electricity, gas, water, sewer and other fuels when those items are paid separately by the tenant.
Marco Island had only 911 renter households in the estimate. The rent burden table could compute a rent-to-income ratio for 637 of them. It counted 425 at 30 percent or more and 314 at 50 percent or more.
Those divisions produce a 66.7 percent burden rate and a 49.3 percent severe-burden rate among records with a computed ratio. The 274 households in the not-computed category stay out of both denominators. Putting them into the denominator would make the city look more affordable without evidence about what they paid relative to income.
The small renter population also makes the estimate less precise than a county measure. Median rent carries a $197 margin of error. The data establish a high-cost and high-burden renter market, but they do not support fine distinctions between one neighborhood or building and another.
What does owning a Marco Island home cost?
The median home value was $896,300. Median monthly owner costs were $3,605 with a mortgage and $1,486 without one. Because 68.9 percent of owner-occupied homes had no mortgage, debt status separates two very different cost structures inside the same city.
The Census mortgage-status table counted 2,394 owner homes with a mortgage or similar debt and 5,304 without one. That mortgage-free share is far above the 54.2 percent measured for Collier County in the 2024 one-year estimate.
Selected monthly owner cost is broader than a loan payment. It includes mortgage and related debt payments, property tax, insurance, utilities, fuel, condominium fees and several other housing expenses. The owner-cost table reports an overall city median of $1,870 because the debt-free group is much larger.
Income burden remains substantial in both groups, although the difference is wide. Among mortgaged owners with a computed ratio, 54.7 percent spent at least 30 percent of household income on housing. Among owners without a mortgage, 22.1 percent crossed that line.
The median real estate tax paid was $5,794. It was $5,730 for homes with a mortgage and $5,832 for homes without one. These figures reflect properties with different assessed values, exemption histories and ownership tenures, so they cannot be converted into one reliable effective rate by dividing them by the median home value.
The central fact is not that Marco Island owners are insulated from housing cost. It is that most of them face a housing bill without a mortgage inside it. Taxes, insurance, utilities, maintenance and association charges remain.
How does Marco Island's property-tax rate work?
Marco Island's municipal rate is 1.2670 mills for fiscal 2027, unchanged from the prior year. That equals $1.267 for each $1,000 of taxable value. The city says its levy represents approximately 14 percent of a resident's total property-tax bill, not the whole bill.
The city's FY27 budget release records the City Council's 22 September 2026 adoption and the 1 October start of the fiscal year. It also names the other authorities that appear separately, including Collier County, the school district, water management, mosquito control, water pollution control and Conservation Collier.
On $500,000 of taxable value, the city portion is $633.50 before any property-specific adjustment. That arithmetic is straightforward: 500,000 divided by 1,000, multiplied by 1.2670. It does not estimate the complete tax bill.
Taxable value is not automatically purchase price or market value. Homestead exemptions, the Save Our Homes assessment cap and authority-specific exemptions can change the base. Non-ad valorem assessments can also appear on the bill outside the millage calculation.
The current municipal rate is useful because it isolates one charge that belongs to the city itself. Our separate analysis of Florida property tax for new residents explains why a new owner's taxable value can differ from the seller's. The Marco Island rate supplies one multiplier after that taxable base is known.
What do water and sewer charges add?
For a standard 5/8 by 3/4 inch meter served by the Marco Island plants, water and sewer base charges total $65.28 a month before use. At 5,000 gallons, the published first-block rates produce a $116.68 illustration before irrigation, special service or account-specific charges.
The city's current utility-rate document portal identifies the May 2020 schedule. The schedule sets a $35.96 water base charge for the smallest listed meter and a $29.32 wastewater base charge for a single-family home or individually metered condominium.
First-block water use costs $4.49 per 1,000 gallons. Wastewater costs $5.79 per 1,000 gallons through 6,000 gallons for a single-family or individually metered condominium customer without a companion meter. Five thousand gallons therefore add $22.45 for water and $28.95 for wastewater.
Add those use charges to the two bases and the result is $116.68. This is an illustration from the tariff, not an average bill. Lot size changes the water budget, larger meters carry higher base charges, companion meters change the sewer calculation, and the Marco Shores service area has a separate schedule.
The base matters in a city with 9,100 seasonal-use homes. A property that uses little water can still face fixed account charges while it is unoccupied. The Census utilities component cannot show that household arrangement. The local tariff can.
Does Marco Island income offset the housing premium?
Median household income was $101,523, but the city's household structure is unusual. Median age was 67.9 and average household size was 1.88. Per capita income reached $95,595, close to the household median because the typical household is small and many residents are beyond conventional working age.
Income changes the capacity to carry a bill. It does not change the price of the home, the tax rate or the utility tariff. The city's high per-person income and high mortgage-free share help explain how an $896,300 median home value can coexist with a smaller combined owner-cost median.
The burden data show where that explanation stops. More than half of mortgaged owners with a computed ratio crossed the 30 percent line, as did two thirds of renters. Debt-free owners had the lowest burden rate, but more than one in five still crossed 30 percent.
Transportation is another piece that broad relocation scores often compress into an index. The vehicle-availability table counted only 280 occupied households without a vehicle. Another 4,623 households had at least two vehicles. That is 53.7 percent of all occupied households.
The table does not price fuel, insurance, maintenance or depreciation. It establishes that the household arrangement is vehicle-heavy despite the city's older age and small households. A personal budget still needs those address-level and household-level costs.
What is the most useful way to read the numbers?
Start with tenure, debt and seasonal status. A renter faces a small market and a $1,990 median gross rent. A mortgaged owner faces a $3,605 median monthly housing bundle. A debt-free owner avoids the loan payment, while taxes, insurance, utilities and association costs remain.
The 103.2 metro index is the broadest answer. It says Collier County prices were modestly above the national level because an expensive housing component outweighed below-average goods, utilities and other services. It does not say Marco Island itself is only 3.2 percent more expensive than the country.
The city data provide the sharper answer. Nearly half of all homes are held for seasonal use. Owners dominate the occupied stock, and most owners have no mortgage. Renters are few and heavily burdened. Current municipal tax and utility rates add bills that depend on taxable value, meter size, service area and use.
That is why one composite score fails here. Marco Island does not have one cost of living. It has several, divided first by who occupies the home and for how much of the year.
What are the short answers to common Marco Island cost questions?
Marco Island is a high-housing-cost city inside a metro whose overall price level is only modestly above the nation. The difference comes from seasonal supply and tenure. Most year-round homes are owner occupied, most owners have no mortgage, and the small renter market carries a high burden rate.
Is Marco Island expensive to live in?
Housing is expensive by the federal city measures. Median home value was $896,300 and median gross rent was $1,990. The broader metro measured only 3.2 percent above the national price level because goods, utilities and other services were below 100 while housing measured 129.4.
Why are so many Marco Island homes vacant?
Most are reserved for seasonal, recreational or occasional use. The Census Bureau counted 9,100 in that category, equal to 92.0 percent of vacant homes. Only 365 vacant units were identified as available for rent.
What is the Marco Island property-tax rate?
The city's fiscal 2027 municipal rate is 1.2670 mills. It is only one part of the bill. The city says it receives approximately 14 percent of total property tax, with the balance going to other taxing authorities.
What is the difference between owning with and without a mortgage?
Median selected monthly owner cost was $3,605 with a mortgage and $1,486 without one. Owners without a mortgage made up 68.9 percent of owner households. Their bill still includes property tax, insurance, utilities, possible condominium fees and other housing costs.