Treasury
3-MO 4.25% +2bp 6-MO 4.32% +2bp 1-YR 4.47% +3bp 2-YR 4.80% +5bp 3-YR 4.89% +4bp 5-YR 5.02% +3bp 7-YR 5.13% +2bp 10-YR 5.24% +2bp 20-YR 5.65% +1bp 30-YR 5.60% unch 3-MO 4.25% +2bp 6-MO 4.32% +2bp 1-YR 4.47% +3bp 2-YR 4.80% +5bp 3-YR 4.89% +4bp 5-YR 5.02% +3bp 7-YR 5.13% +2bp 10-YR 5.24% +2bp 20-YR 5.65% +1bp 30-YR 5.60% unch 3-MO 4.25% +2bp 6-MO 4.32% +2bp 1-YR 4.47% +3bp 2-YR 4.80% +5bp 3-YR 4.89% +4bp 5-YR 5.02% +3bp 7-YR 5.13% +2bp 10-YR 5.24% +2bp 20-YR 5.65% +1bp 30-YR 5.60% unch 3-MO 4.25% +2bp 6-MO 4.32% +2bp 1-YR 4.47% +3bp 2-YR 4.80% +5bp 3-YR 4.89% +4bp 5-YR 5.02% +3bp 7-YR 5.13% +2bp 10-YR 5.24% +2bp 20-YR 5.65% +1bp 30-YR 5.60% unch 3-MO 4.25% +2bp 6-MO 4.32% +2bp 1-YR 4.47% +3bp 2-YR 4.80% +5bp 3-YR 4.89% +4bp 5-YR 5.02% +3bp 7-YR 5.13% +2bp 10-YR 5.24% +2bp 20-YR 5.65% +1bp 30-YR 5.60% unch 3-MO 4.25% +2bp 6-MO 4.32% +2bp 1-YR 4.47% +3bp 2-YR 4.80% +5bp 3-YR 4.89% +4bp 5-YR 5.02% +3bp 7-YR 5.13% +2bp 10-YR 5.24% +2bp 20-YR 5.65% +1bp 30-YR 5.60% unch
US Treasury par yield curve · Oct 9 · Source: U.S. Treasury
Tuesday, October 13, 2026
U.S. Edition
September sales

Existing-home sales rise 1.5 percent, remain below last year

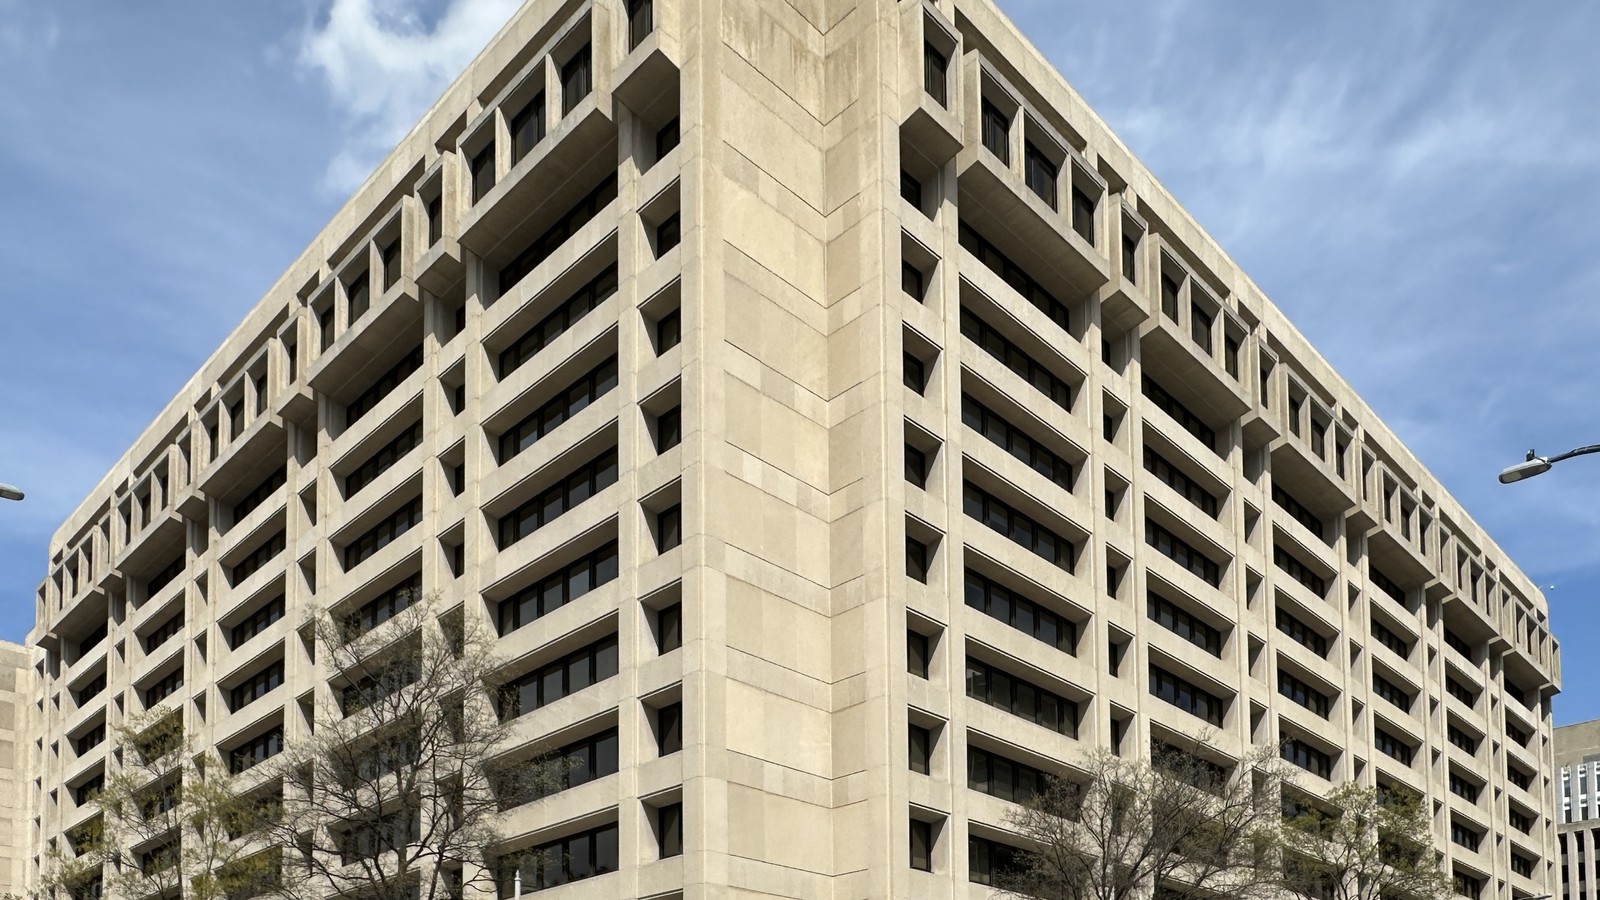
Upper floors of the National Association of Realtors building in Washington, photographed in 2007.
Photo: Williamborg / Wikimedia Commons (Public domain; cropped)

U.S. existing-home sales rose 1.5 percent in September to a seasonally adjusted annual rate of 3.99 million, the National Association of Realtors reported Tuesday. Sales remained 2.2 percent below September 2025.

Inventory grew. There were 1.60 million homes available at month-end, up 4.6 percent from a year earlier. That represented 4.8 months of supply at the current sales pace, compared with 4.5 months last September.

The median sale price was $417,500, up 1.3 percent over the year. Single-family sales rose 2 percent from August, while condominium and co-op sales fell 2.8 percent. Every region recorded fewer sales than a year earlier.