Treasury
3-MO 4.14% +2bp 6-MO 4.24% +4bp 1-YR 4.44% +4bp 2-YR 4.76% +9bp 3-YR 4.83% +8bp 5-YR 4.86% +8bp 7-YR 4.93% +7bp 10-YR 5.01% +7bp 20-YR 5.38% +6bp 30-YR 5.34% +5bp 3-MO 4.14% +2bp 6-MO 4.24% +4bp 1-YR 4.44% +4bp 2-YR 4.76% +9bp 3-YR 4.83% +8bp 5-YR 4.86% +8bp 7-YR 4.93% +7bp 10-YR 5.01% +7bp 20-YR 5.38% +6bp 30-YR 5.34% +5bp 3-MO 4.14% +2bp 6-MO 4.24% +4bp 1-YR 4.44% +4bp 2-YR 4.76% +9bp 3-YR 4.83% +8bp 5-YR 4.86% +8bp 7-YR 4.93% +7bp 10-YR 5.01% +7bp 20-YR 5.38% +6bp 30-YR 5.34% +5bp 3-MO 4.14% +2bp 6-MO 4.24% +4bp 1-YR 4.44% +4bp 2-YR 4.76% +9bp 3-YR 4.83% +8bp 5-YR 4.86% +8bp 7-YR 4.93% +7bp 10-YR 5.01% +7bp 20-YR 5.38% +6bp 30-YR 5.34% +5bp 3-MO 4.14% +2bp 6-MO 4.24% +4bp 1-YR 4.44% +4bp 2-YR 4.76% +9bp 3-YR 4.83% +8bp 5-YR 4.86% +8bp 7-YR 4.93% +7bp 10-YR 5.01% +7bp 20-YR 5.38% +6bp 30-YR 5.34% +5bp 3-MO 4.14% +2bp 6-MO 4.24% +4bp 1-YR 4.44% +4bp 2-YR 4.76% +9bp 3-YR 4.83% +8bp 5-YR 4.86% +8bp 7-YR 4.93% +7bp 10-YR 5.01% +7bp 20-YR 5.38% +6bp 30-YR 5.34% +5bp
US Treasury par yield curve · Sep 18 · Source: U.S. Treasury
Monday, September 21, 2026
U.S. Edition
August activity index

Chicago Fed activity index slips below zero in August as production weakens

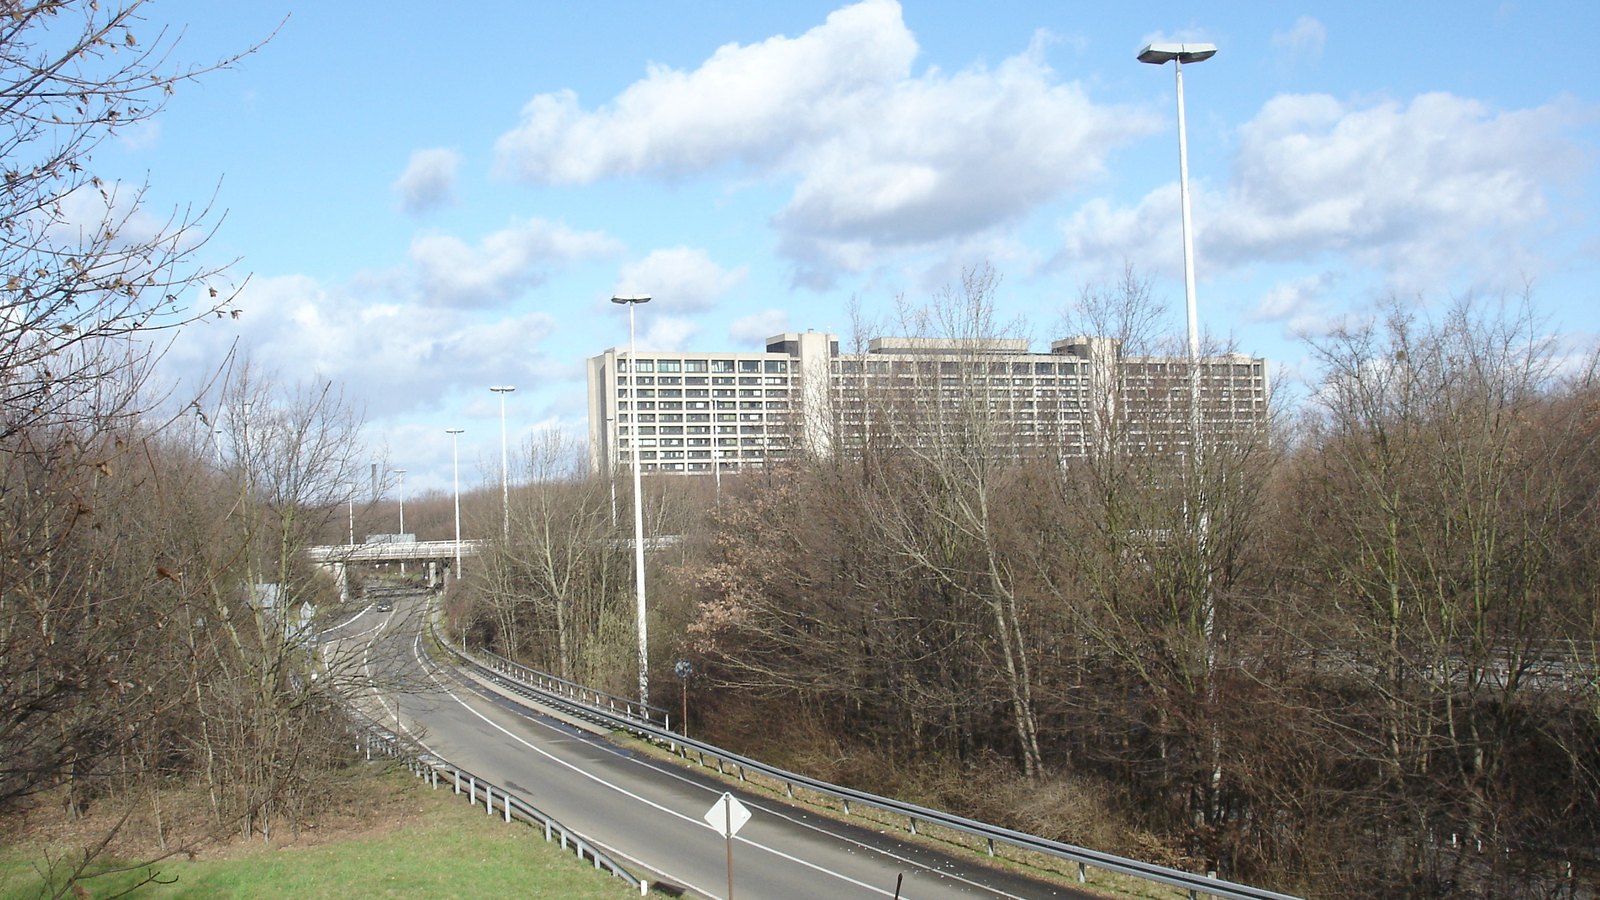
The Federal Reserve Bank of Chicago building seen from street level beneath a blue sky.
Photo: Warren LeMay / Wikimedia Commons (CC BY-SA 2.0)

The Chicago Fed National Activity Index fell to minus 0.04 in August from plus 0.08 in July, according to the latest release. A zero reading corresponds to growth at the economy's historical trend.

The drag came from production. Production-related indicators contributed minus 0.07, down from roughly zero in July. Sales, orders and inventories contributed zero after adding 0.15 in July.

Employment added 0.01 after subtracting 0.01 in July. Personal consumption and housing added 0.01 after subtracting 0.06.

The three-month moving average rose to plus 0.01 from minus 0.01. The diffusion index fell to plus 0.02, with 39 of 85 indicators making positive contributions and 46 making negative contributions.