Australian headline inflation fell to 3.5 percent in July, and the trimmed mean it is now sitting below did not move at all
Three point five.
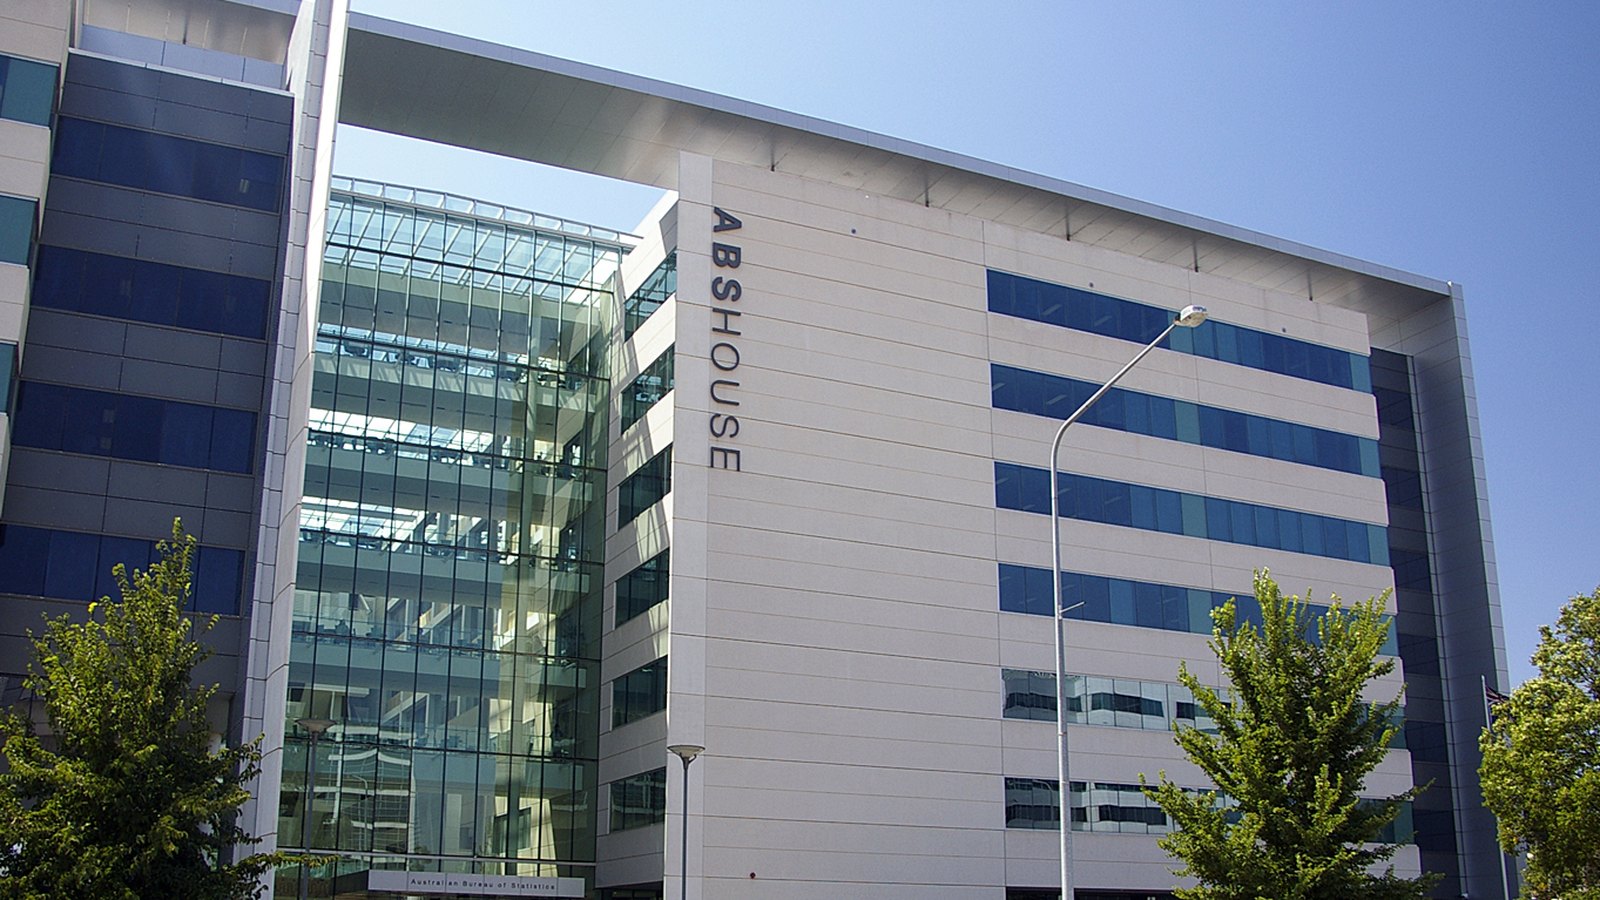
That is the annual rate on the Australian Bureau of Statistics monthly consumer price index for July, published at 11.30am Australian eastern standard time on Wednesday. It is down from 3.8 percent in the year to June. The trimmed mean, which drops the largest price rises and falls at either end of the distribution before averaging what is left, came in at 3.6 percent, exactly where it sat the month before.
So headline is now below underlying. Reading the two series the release prints side by side, that has not happened since July 2025.
Where the three tenths went
The ABS publishes what each group contributed to the annual movement, in percentage points, and one line accounts for effectively the whole of it. Housing contributed 1.4774 points in June and 1.0997 points in July. That is a fall of about 0.38 points, against a headline rate that fell 0.3 points. Nothing else in the table moves anywhere near as far, and the largest change among the remaining seven groups is Recreation and culture, down about 0.09 points.
Housing is not cheap. Its annual rate of 5.0 percent is still the highest of any group, and the ABS names the driver as new dwellings, up 5.7 percent over the year. Rachael McCririck, the ABS head of price statistics, attributed that to builders passing on "higher costs for materials and labour". The group is contributing less than it was. It is not falling.
Transport went the other way, contributing 0.1841 points against 0.0100 in June, with its annual rate up from 0.1 percent to 1.6 percent.
Fuel rose and the headline fell anyway
Automotive fuel prices rose 7.5 percent in the month of July, after falling for three months in a row. McCririck attributed the rise to "higher world oil prices and the partial unwinding of the federal government's fuel excise relief measures in July".
That is the shape of the month. The component most visible to a household went up hard and the headline rate came down, because the annual figure is a comparison with July 2025 rather than a description of what happened in July 2026.
Which version of the month
In the month itself the index rose 1.0 percent in original terms and 0.6 percent seasonally adjusted. The gap is widest in housing, where the original series rose 0.4 percent and the seasonally adjusted series fell 0.3 percent.
Both of the underlying measures the ABS publishes alongside the headline read 3.6 percent. Monthly and seasonally adjusted, the trimmed mean rose 0.5 percent and the weighted median 0.4 percent, against 0.6 percent for the headline.
Goods inflation was 3.2 percent, down from 3.5. Services was 3.7 percent, down from 4.0.
The Reserve Bank comparison that does not work
The Reserve Bank of Australia held the cash rate on 11 August and said in the same statement that trimmed mean inflation "also remains elevated and is little changed from the March quarter". The forecast table it publishes carries a quarterly trimmed mean.
This release publishes a monthly one, and says in its own release notes that the quarterly trimmed mean built on pre-October 2025 methods sits in a separate appendix. The two are not the same series, and setting one against the other is a comparison the ABS does not make.
Two dates in the release notes
From February 2027 the CPI moves to the fourth Wednesday of each month rather than the final Wednesday. The ABS says a review found the earlier release would have no impact on the quality of the data.
The weight update postponed earlier this year will now be made for January 2027, published on 24 February 2027. The ABS says it monitored household spending data and determined that a mid-2026 update was not needed.
August figures are due on 30 September.