Treasury
3-MO 4.11% unch 6-MO 4.17% -1bp 1-YR 4.39% +2bp 2-YR 4.67% +2bp 3-YR 4.76% +3bp 5-YR 4.83% +3bp 7-YR 4.91% +3bp 10-YR 5.00% +3bp 20-YR 5.40% +3bp 30-YR 5.36% +2bp 3-MO 4.11% unch 6-MO 4.17% -1bp 1-YR 4.39% +2bp 2-YR 4.67% +2bp 3-YR 4.76% +3bp 5-YR 4.83% +3bp 7-YR 4.91% +3bp 10-YR 5.00% +3bp 20-YR 5.40% +3bp 30-YR 5.36% +2bp 3-MO 4.11% unch 6-MO 4.17% -1bp 1-YR 4.39% +2bp 2-YR 4.67% +2bp 3-YR 4.76% +3bp 5-YR 4.83% +3bp 7-YR 4.91% +3bp 10-YR 5.00% +3bp 20-YR 5.40% +3bp 30-YR 5.36% +2bp 3-MO 4.11% unch 6-MO 4.17% -1bp 1-YR 4.39% +2bp 2-YR 4.67% +2bp 3-YR 4.76% +3bp 5-YR 4.83% +3bp 7-YR 4.91% +3bp 10-YR 5.00% +3bp 20-YR 5.40% +3bp 30-YR 5.36% +2bp 3-MO 4.11% unch 6-MO 4.17% -1bp 1-YR 4.39% +2bp 2-YR 4.67% +2bp 3-YR 4.76% +3bp 5-YR 4.83% +3bp 7-YR 4.91% +3bp 10-YR 5.00% +3bp 20-YR 5.40% +3bp 30-YR 5.36% +2bp 3-MO 4.11% unch 6-MO 4.17% -1bp 1-YR 4.39% +2bp 2-YR 4.67% +2bp 3-YR 4.76% +3bp 5-YR 4.83% +3bp 7-YR 4.91% +3bp 10-YR 5.00% +3bp 20-YR 5.40% +3bp 30-YR 5.36% +2bp
US Treasury par yield curve · Sep 15 · Source: U.S. Treasury
Wednesday, September 16, 2026
U.S. Edition
United States

US business inventories rise 0.8 percent as sales gain 0.3 percent

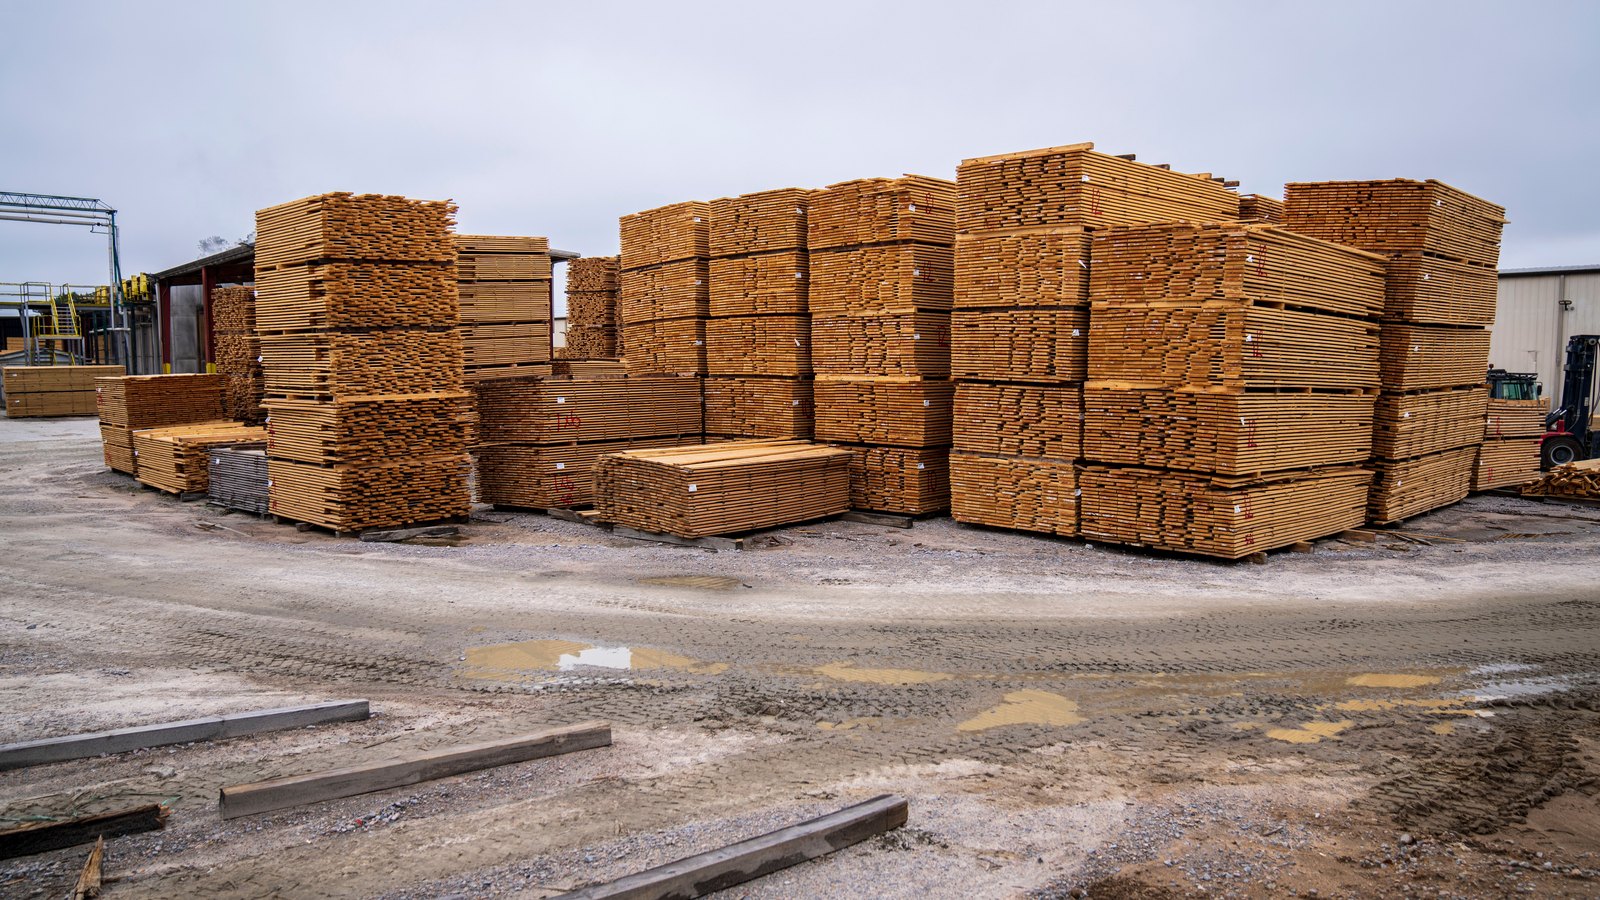
Rows of pallet racks hold wrapped goods in a warehouse. Stock photo
Stock photo. Not the actual scene. Photo: Tiger Lily / Pexels

$2.76tn. That was the value of US business inventories at the end of July, up 0.8 percent from June, the Census Bureau said Wednesday.

Combined sales and manufacturers' shipments reached $2.12tn, up 0.3 percent for the month and 8.9 percent from a year earlier. Inventories were 3.8 percent higher over the year.

The inventories-to-sales ratio held at 1.30 in July and fell from 1.37 a year earlier. The report adjusts for seasonal, holiday and trading day differences, but not for price changes.