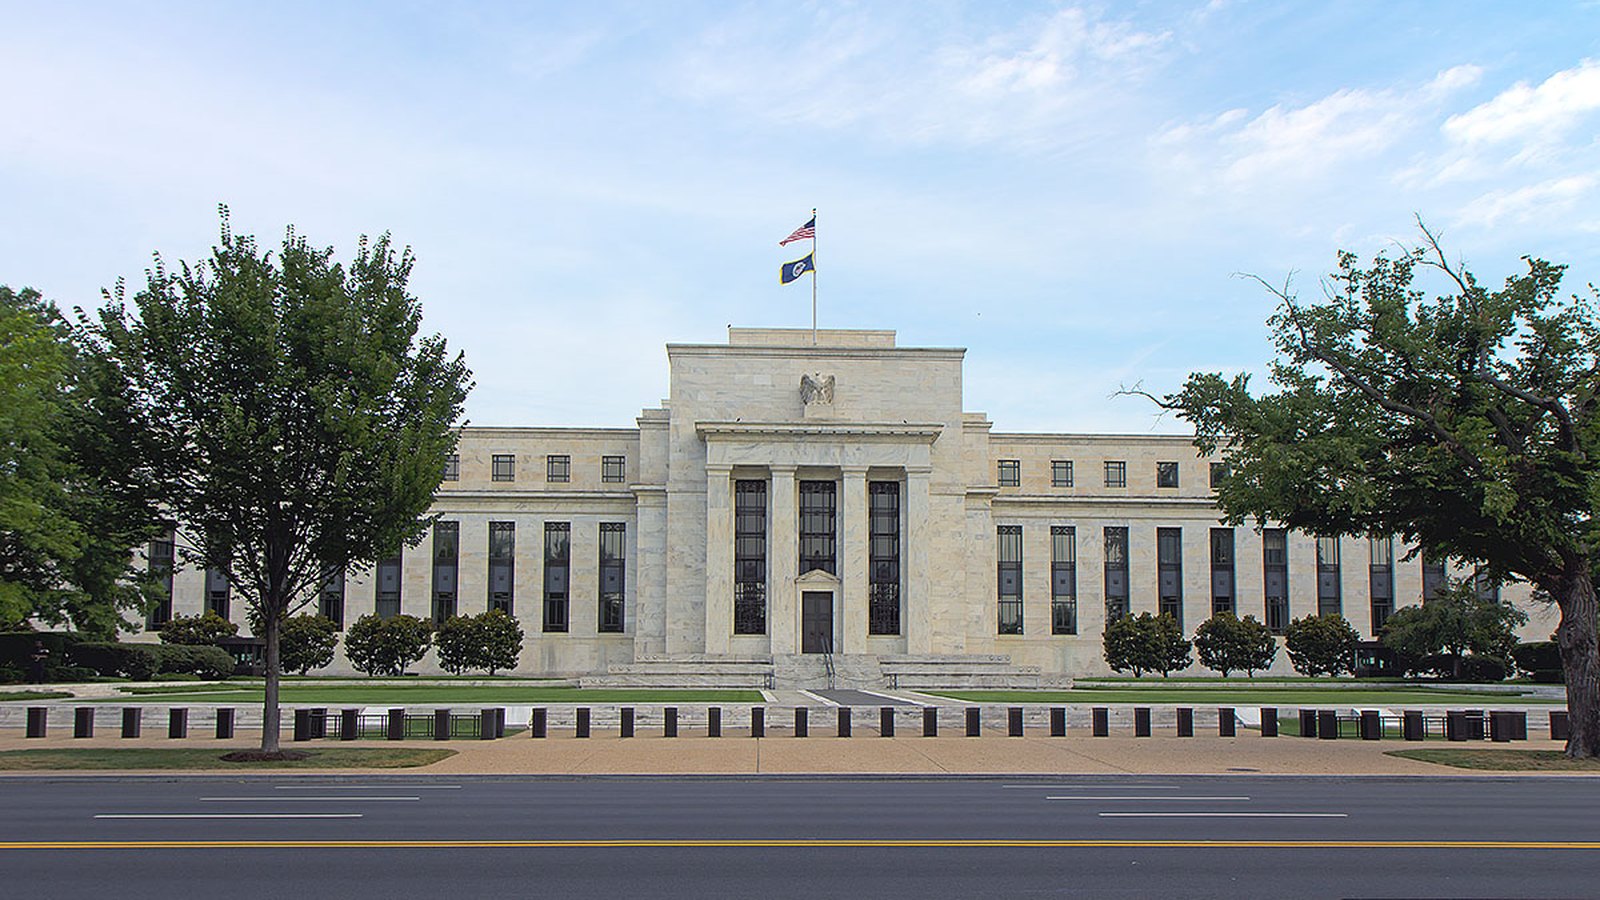
The interest "record" holds by 0.09 of a point, and only if you start counting in 1940
Thirty of the forty-six years before the data series begins beat last year's figure. On the government's own on-budget accounting, 1991 still holds the record. None of which makes the underlying trend less alarming, and that is the point.
You have probably seen the number. Interest on the federal debt is consuming a larger share of federal revenue than at any point in American history. The Peter G. Peterson Foundation tracks it monthly. Fortune ran it in May. Econofact fact-checked it in June and found it holds.
The figure is 18.53 percent of receipts in fiscal 2025, edging past the previous high set in 1991.
It is a real number and the arithmetic is correct. It also rests on two choices that are almost never stated, and if you change either one, the record stops being a record.
The first choice is 1940
Every version of this claim traces to the same source: OMB's historical table of outlays by function. The table is authoritative and the number is right.
The table begins in 1940.
That is not a judgement about what matters. It is where the file starts. And the years behind that boundary are not quiet.
| Fiscal year | Net interest as a share of receipts |
|---|---|
| 1878 | 39.77 percent |
| 1933 | 34.52 percent |
| 1923 | 27.41 percent |
| 1991 | 18.43 percent |
| 2025 | 18.53 percent |
Thirty of the forty-six years before 1940 exceed last year's figure. Even applying the most punitive gross-to-net adjustment the historical record will support, 22 of the 46 still beat it.
Three different mechanisms produced them. Civil War debt service on a small revenue base ran the 1870s figures. First World War debt did the 1920s. And the 1933 spike is the one worth understanding, because interest did not rise to produce it. Interest actually fell through the 1920s. Receipts collapsed. The Depression destroyed the denominator.
So the accurate sentence is not "the highest ever." It is "the highest in 92 years." Econofact notes the 1940 bound in a single clause. The Peterson Foundation's tracker states no bound at all.
The second choice is the denominator
Now hold 1940 fixed and change only what you divide by. There are four defensible options and they split two against two.
| Denominator | FY1991 | FY2025 | Winner |
|---|---|---|---|
| Total receipts (the one everyone quotes) | 18.43% | 18.53% | 2025, by 0.09 points |
| Non-payroll receipts | 29.51% | 27.81% | 1991, by 1.70 |
| On-budget interest over on-budget receipts (OMB's own concept) | 28.21% | 26.31% | 1991, by 1.89 |
| Non-payroll receipts plus off-budget surplus | 27.34% | 29.04% | 2025, by 1.70 |
The record survives on exactly one measure, by nine hundredths of a point. On the government's own on-budget accounting, the measure OMB itself publishes, 1991 still holds it by twenty times that margin, and 2025 ranks sixth.
The disagreement is not noise. It has a mechanism, and the mechanism is the actual story.
In 1991 payroll taxes were 37.54 percent of federal receipts, against 33.39 percent now. More importantly, in 1991 Social Security was running a $52.2bn surplus that lent cash to the general fund. In 2025 it ran a $147.9bn deficit that drained it. Whether you count money the government is borrowing from itself as revenue available to pay interest is a real accounting question with no obviously right answer, and it decides the winner.
Where this piece could go wrong
We want to be careful, because an argument that a frightening number is softer than reported can be read as saying the debt is fine.
It is not saying that. It is saying the ranking is unknowable and the trend is undeniable, and those are different claims.
Here is what does not depend on any of the above. No denominator, no start date, no accounting concept.
Since fiscal 2015, the federal debt has grown 142.3 percent. The interest paid on it has grown 364.2 percent. The effective interest rate the Treasury pays has roughly doubled, a factor of 1.92.
That gap between 142 and 364 is not a measurement artifact. It is not sensitive to which receipts you count. It is the rate, and it is the entire problem. The government borrowed a great deal more, and then the price of borrowing went up underneath the pile it had already built.
That is a worse fact than the one in the headline everyone is running, and it needs no records to be alarming.
What we cannot tell you
We never examined anything before 1866. The true all-time peak is unknown to us. We will not write "ever" or "all-time," and neither should the coverage we are criticising.
The Civil War figures are single-source. They reconcile against our own OMB file for 1919 through 1933, ten of ten to the dollar, and the divergence after 1934 appears exactly where the administrative-to-unified budget shift predicts it should. The 1870s rows do not have that corroboration.
The fourth denominator flips our own finding back. Line four of that table, arguably the roughest construction, hands 2025 the record again by 1.70 points. We have left it in rather than quietly drop the version that disagrees with us.
All three of the figures in circulation are nine-month figures, not annual. The $857bn, the 13 percent, and the roughly $1.4tn deficit all cover October through June. We measured the annualisation bias rather than assuming it: the October-to-June window runs about 0.90 points hot against the full year, with a standard deviation of 0.71. Compare like with like and it is 20.64 percent against 18.93.
One correction to our own working, recorded here because it nearly changed the piece. Partway through, the gap between gross and net interest looked like it was widening. It is not. It is collapsing, from 42.0 percent of gross in fiscal 2015 to 18.6 percent now. A single year's move suggested the opposite and we had it backwards until we extended the series.
Method, and the data
Figures come from OMB Historical Tables (Table 1.1 for receipts and outlays, Table 3.1 for outlays by function), the Monthly Treasury Statement, and Treasury's interest expense data. The pre-1940 receipts come from historical Treasury annual reports via FRASER, the St. Louis Fed's archive.
The claims we are arguing with are the Peterson Foundation's tracker and Econofact's June fact-check. Both are worth reading; our disagreement is with the framing, not the arithmetic.
Take it and check us:
- The full working: every computation, every denominator, every caveat
- Monthly Treasury Statement data: as pulled
- Debt figures: as pulled
One warning for anyone reproducing it. The OCR text layer on the FRASER scans is materially wrong. It gave us a 17 percent error on fiscal 1932 that would have produced the wrong peak year entirely. Use the page images, not the text.
Jonathan Rauh's 2024 work is the nearest prior art on excluding payroll receipts. The on-budget reversal and the pre-1940 comparison we could not find published anywhere. If they are, or if we have this wrong, write to corrections@moneyandworld.com and we will correct it and say so.
Correction, July 15, 2026: when first published, this section said the working and the raw files were published alongside the piece. They were not. They are now, and are linked above. See Corrections.