The inflation gap is a weights problem, not a formula problem
The July CPI rose 0.1 percent while the PCE price index rose 0.2 percent. The useful question is not which measure was right. It is which categories pulled them apart, and the government's reconciliation table answers it to the hundredth of a percentage point.
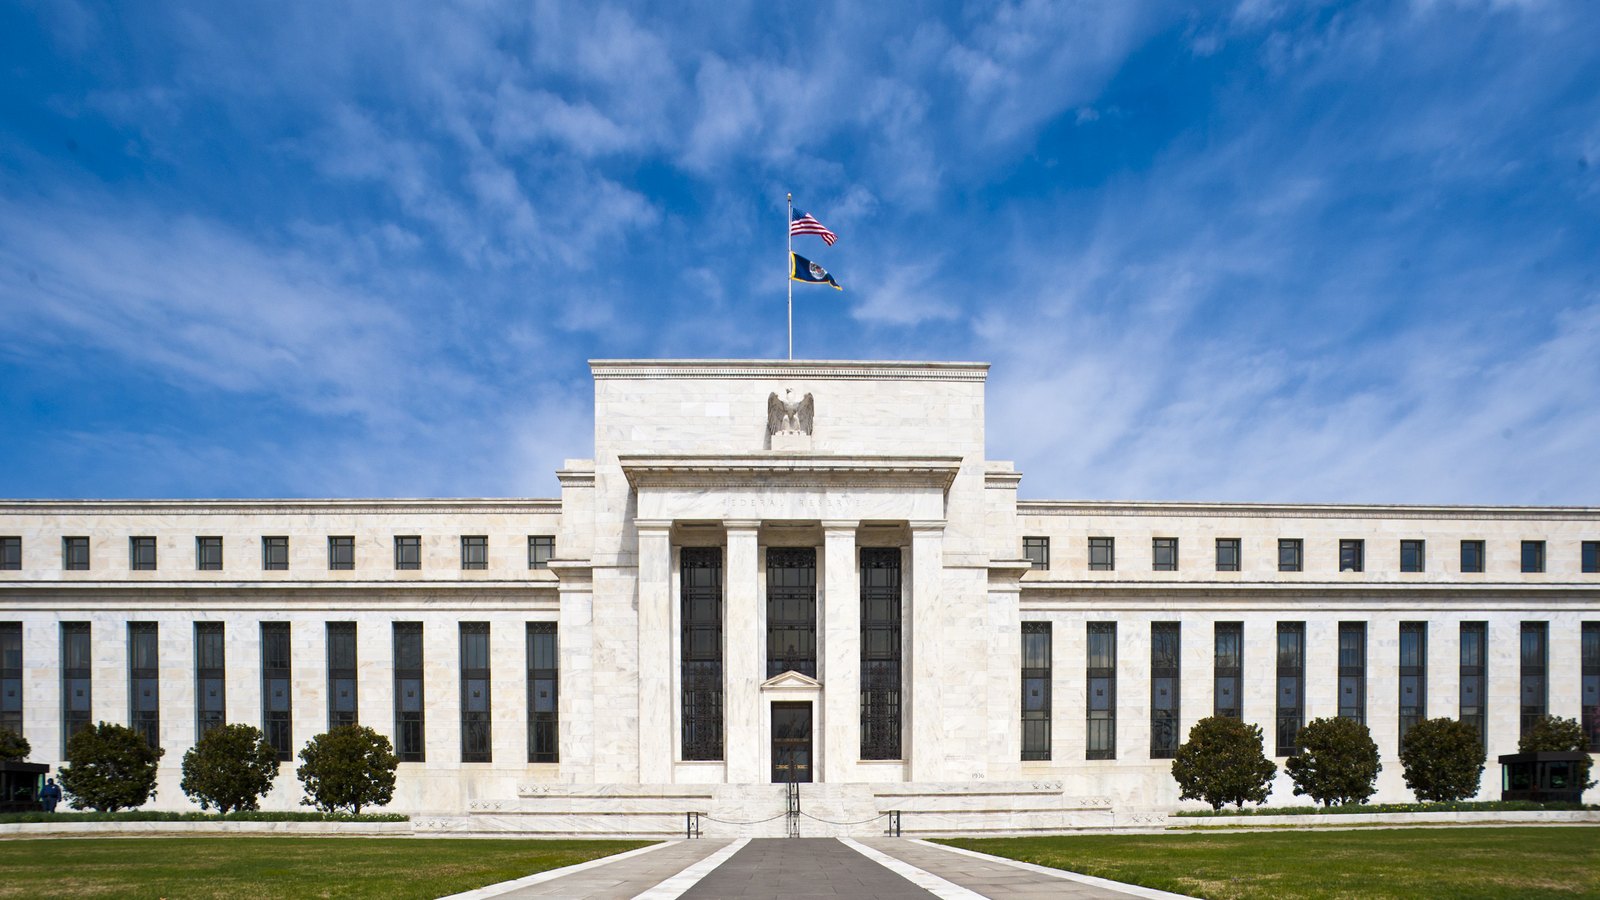
The two leading US inflation measures disagreed in July. The consumer price index rose 0.1 percent after seasonal adjustment. The personal consumption expenditures price index rose 0.2 percent. Both figures were correct.
The difference did not come from one agency finding inflation that the other missed. It came from two statistical systems asking related but distinct questions. CPI tracks the prices paid directly by urban consumers for a fixed market basket. PCE tracks a broader set of goods and services consumed by households, including some bills paid on their behalf, and lets spending patterns change more quickly.
Those definitions are familiar. The more useful evidence sits in a spreadsheet that receives much less attention. The Bureau of Economic Analysis publishes a monthly reconciliation table that assigns the gap to four effects: formula, weights, scope and other measurement differences. It turns a vague argument about rival gauges into an accounting exercise.
Money & World analyzed every comparable month in that table from January 2002 through July 2026. There were 293 of them. Expenditure weights were the uniquely largest component, measured by absolute size, in 154 months. Scope led in 68. Other measurement effects led in 30. There were 40 ties.
The formula was the uniquely largest component once.
That result changes how the monthly gap should be read. The principal issue is usually not that CPI uses a fixed-weight formula while PCE uses a chain-type formula. It is that housing, health care, gasoline and other categories occupy different shares of the two measures, or appear in only one of them.
What is the difference between CPI and PCE inflation?
CPI measures out-of-pocket prices for urban consumers using expenditure weights updated annually. PCE covers consumption by and on behalf of all households, uses business and administrative records alongside household surveys, and updates weights from one period to the next. They are different views of household inflation, not competing estimates of one identical basket.
The Bureau of Labor Statistics constructs CPI from prices for a consumer basket and expenditure data reported by households. The Bureau of Economic Analysis constructs PCE as part of the national accounts, drawing heavily on what businesses report selling. The agencies also treat the population, transactions and weights differently.
Four labels cover the monthly difference in BEA's bridge:
- Formula effect. CPI uses a modified Laspeyres index at the upper level. PCE uses a Fisher-Ideal formula that averages indexes based on current and prior-period quantities. The PCE formula therefore responds more quickly when consumers shift spending between categories.
- Weight effect. The same category can have a different expenditure share in each index. Shelter is the famous example. Its price can rise by the same amount in both systems and still move CPI more because shelter has more weight there.
- Scope effect. PCE includes expenditures outside CPI's direct household purchases. Employer-paid medical care is an important case. CPI, in turn, contains a small set of items outside PCE's scope.
- Other effects. Seasonal adjustment, different source prices and residual measurement differences land here.
BEA describes those categories in its official reconciliation FAQ. The labels are not editorial judgments. They are the government's published decomposition.
What created the CPI versus PCE inflation gap in 2026?
The source of the gap changed sharply from month to month. Weights pushed CPI 25 basis points above PCE in March, then 18 basis points below it in June. Net scope effects pushed CPI below PCE in five of seven months. Formula effects never exceeded two basis points in absolute size during the period.
The table below converts BEA's presentation into contributions to CPI minus PCE. A positive number pulls CPI above PCE. A negative number pulls it below. One basis point is one-hundredth of a percentage point.
| 2026 month | PCE change | CPI change | Formula | Weights | Net scope | Other | Bridge total |
|---|---|---|---|---|---|---|---|
| January | 0.3% | 0.2% | 0 bp | -9 bp | -12 bp | +3 bp | -18 bp |
| February | 0.4% | 0.3% | 0 bp | -11 bp | -3 bp | +1 bp | -13 bp |
| March | 0.7% | 0.9% | +1 bp | +25 bp | -8 bp | +1 bp | +19 bp |
| April | 0.4% | 0.6% | +2 bp | +16 bp | +1 bp | +3 bp | +22 bp |
| May | 0.5% | 0.5% | +2 bp | +14 bp | -18 bp | +1 bp | -1 bp |
| June | -0.1% | -0.4% | -2 bp | -18 bp | -5 bp | -9 bp | -34 bp |
| July | 0.2% | 0.1% | 0 bp | 0 bp | -10 bp | +2 bp | -8 bp |
The bridge total will not always equal a subtraction of the displayed headline rates. BEA publishes the headline monthly changes to one decimal place and the components to two. In July, for example, the visible rates imply a 10-basis-point gap while the more precise bridge components sum to negative eight. That is rounding, not missing arithmetic.
The sequence also shows why a single durable explanation for the gap will fail. March was mostly a gasoline weight story. May was a contest between weights pushing CPI up and scope pushing it down. June combined negative weight, scope and other effects. July was principally a scope story.
Why does shelter pull CPI and PCE inflation apart?
Shelter receives much more weight in CPI than in PCE because CPI focuses on consumers' direct spending. In the December 2025 CPI basket, shelter represented 35.3 percent of all items. When rent measures rise faster than the rest of the basket, that large weight tends to lift CPI relative to PCE.
The BLS relative-importance table put shelter at 35.333 percent of the all-items CPI in December 2025. Most of that was rent of primary residence and owners' equivalent rent. Owners' equivalent rent estimates what owner-occupied homes would rent for, excluding utilities. It is a price for housing services, not a house-price index or a mortgage payment.
BEA's bridge isolates the result as a weight effect for rent of shelter. That contribution pushed CPI below PCE by five basis points in July, four in June, six in May and ten in April. The negative sign may look surprising during a period of rising rent. It means that the relative monthly movement in shelter, combined with the indexes' different weights, pulled CPI downward compared with PCE in those particular months. A large weight amplifies direction. It does not guarantee an upward contribution.
Shelter also moves slowly. Rent data are sampled in panels, and measured rents adjust as leases turn over. This creates persistence in CPI. PCE uses the same core rent measures but embeds them in a broader consumption basket. The disagreement is therefore chiefly about the share of the total, not two separate judgments about what rent did.
Why can gasoline reverse the inflation gap?
Gasoline prices are volatile and receive different weights in the two indexes. Their weight effect pushed CPI 23 basis points above PCE in March 2026, then 14 basis points below it in June. A category can reverse the gap without any disagreement about its posted price because its influence on each basket differs.
March supplies the cleanest example. BEA assigned negative 23 basis points to gasoline inside the PCE-minus-CPI weight effect. Restated as CPI minus PCE, gasoline contributed positive 23 basis points. That one line accounts for almost all of the positive 25-basis-point total weight effect that month.
June went the other way. Gasoline contributed negative 14 basis points to CPI relative to PCE. The all-items CPI fell 0.4 percent that month while PCE fell 0.1 percent. Gasoline was not the entire explanation, but its different weight did most of the work inside the weight category.
The next CPI release shows the danger of carrying an old decomposition forward. The August CPI report says the gasoline index rose 3.9 percent and accounted for more than one-third of the 0.4 percent monthly increase in all items. That does not yet reveal the August CPI-PCE bridge. The matching PCE figures are still unpublished.
What does the scope effect include?
Scope captures spending present in one index but absent from the other. PCE-only items include medical services paid by employers or government, financial services furnished without an explicit charge, foreign travel by US residents and nonprofit services. CPI-only items are smaller. The net effect pushed CPI 10 basis points below PCE in July.
This is where the word “consumer” creates confusion. CPI largely follows payments consumers make themselves. PCE asks what households consume regardless of who pays. Health insurance provided through an employer, and Medicare or Medicaid payments made for a household, can enter PCE even when the patient never sees the full transaction.
In July, PCE-only scope effects totaled 11 basis points in BEA's table. Other PCE-only items contributed 12 basis points, partly offset by foreign travel at negative three. Hospital and nursing-home services added one basis point. Financial services furnished without payment added one. Nonprofit institutions serving households added one. CPI-only items added one basis point in the opposite direction. The net contribution to CPI minus PCE was therefore negative ten.
May was larger. PCE-only scope effects totaled 18 basis points while CPI-only effects rounded to zero. The broad “other” PCE-only line contributed nine basis points and foreign travel contributed three. Those are not errors or statistical noise. They are purchases one measure is designed to include and the other is not.
Does the index formula explain most of the CPI-PCE gap?
No. In 293 comparable months from January 2002 through July 2026, the formula effect averaged 1.8 basis points in absolute size. Weights averaged 7.8 basis points, net scope 5.1 and other effects 3.1. Formula was the uniquely largest component in only one month, April 2020.
The historical count makes the ranking plain:
| Largest absolute bridge component | Months | Share of 293 months |
|---|---|---|
| Weights | 154 | 52.6% |
| Net scope | 68 | 23.2% |
| Other effects | 30 | 10.2% |
| Formula | 1 | 0.3% |
| Tie for largest | 40 | 13.7% |
April 2020 was exceptional for obvious economic reasons. Spending patterns broke abruptly at the start of the pandemic. The formula effect put CPI 20 basis points below PCE. Other measurement effects put it 18 basis points below, scope put it 11 above and weights put it 10 below. Formula won, but barely, in a month when the underlying economy was moving too quickly for normal relationships to hold.
This does not make the formula irrelevant. Chaining is one reason economists prefer PCE for tracking broad consumption over time. It does mean that formula is a poor default explanation for a particular month's difference. A reader should inspect weights and scope first.
The full monthly calculation is available in the accompanying CSV file. The source is Table 9.1U, not an estimated reconstruction from the two headline series.
Which inflation measure does the Federal Reserve use?
The Federal Reserve defines price stability as 2 percent inflation over the longer run measured by the annual change in the PCE price index. It does not ignore CPI. Policymakers examine a wide range of indicators, but the stated target and official projections use PCE because of its broader scope and adaptable weights.
The distinction matters whenever a CPI release is described as the Fed's preferred gauge. It is not. The Federal Open Market Committee's 2026 statement on longer-run goals identifies the PCE measure explicitly. The same statement says policy decisions consider a wide range of information, which is why CPI can still move markets and shape the policy debate.
PCE is also revised with the national accounts. That is a feature for economists seeking a coherent history and a complication for anyone treating the first monthly print as permanent. CPI is rarely revised beyond routine seasonal-factor updates. The choice is between different analytical strengths, not a clean measure and a faulty one.
For households, CPI may feel closer to the monthly experience because it gives more weight to direct housing costs and excludes spending made on their behalf. For the central bank, PCE offers broader coverage and substitution across categories. Both claims can be true at once.
How was this monthly inflation bridge calculated?
Money & World used the monthly columns in BEA Table 9.1U and restated every component as a contribution to CPI minus PCE. BEA prints several rows as amounts subtracted from PCE. Their signs were reversed. CPI-only scope was added. Months without a complete official reconciliation were excluded rather than estimated.
The source workbook was published on August 26, 2026, with data through July. October and November 2025 have no monthly bridge values because the statistical agencies did not publish the required releases during the federal funding lapse. That leaves 293 comparable observations from a possible 295 between January 2002 and July 2026.
For each month, the analysis compared the absolute values of four normalized components:
- formula;
- expenditure weights;
- PCE-only scope subtracted from CPI-only scope, shown here as net scope; and
- other effects.
A component counted as the largest only when it exceeded all three others. Equal maximum values were classified as ties. Mean sizes are the arithmetic means of absolute monthly contributions. No annual rate was substituted for a monthly change, and no unavailable month was filled by interpolation.
The BEA reconciliation paper, written jointly by BEA and BLS economists, provides the conceptual basis for the bridge. The current spreadsheet provides the figures. This analysis adds the sign normalization, historical counts and absolute averages so that the components can be compared consistently.
When will August CPI and PCE inflation be comparable?
BEA is scheduled to release August personal income and outlays at 8:30 a.m. Eastern time on September 30, 2026. Until then, July is the latest valid month for a CPI-PCE comparison. August CPI is known, but placing it beside July PCE would compare different price periods and answer no useful question.
The timing gap is normal. BLS usually publishes CPI before BEA publishes PCE. The July personal income and outlays release lists the next release date and notes that it will arrive with the 2026 annual update of the national economic accounts.
That annual update is another reason to treat the CSV as a dated record rather than an eternal table. BEA can revise PCE history as better source data arrive and accounting relationships are reconciled. The article states the publication date and file hash so a later revision can be distinguished from the evidence used here.
What else should readers know about CPI and PCE?
The monthly gap is an accounting result, not a verdict about which index describes every household. Compare the same month, read the sign of each bridge component and match the measure to the question. CPI is closer to direct urban-consumer spending. PCE is broader and is the Federal Reserve's target measure.
Can CPI rise while PCE falls?
Yes. Different weights and scope can produce opposite monthly movements, especially when a volatile category carries substantially different influence in the two baskets. The bridge will show which effects produced the divergence.
Is core CPI the same as core PCE?
No. Both exclude food and energy, but they retain the same broader differences in formula, weights, scope and source data as the headline indexes. Removing two categories does not make the remaining baskets identical.
Which measure should a household use for its own budget?
Neither is a personal cost-of-living statement. CPI often maps more closely to direct household bills, while PCE captures services paid on a household's behalf. A household budget should use its actual spending shares, especially for housing, insurance, health care and transportation.